. 2021 Aug 4;129(8):087001. doi: 10.1289/EHP9018

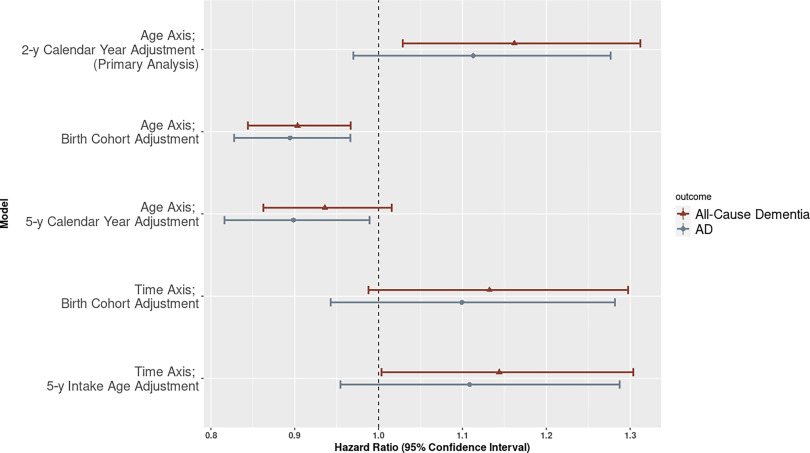
Figure 3.

Figure 3 is an error bar graph with hazard ratio estimates and their 95 percent confidence intervals for the all cause dementia and Alzheimer disease outcomes. There are five analyses shown: the age axis with 2-year calendar year adjustment (primary analysis); the age axis with birth cohort adjustment; the age axis with 5-year calendar year adjustment; the time axis with birth cohort adjustment; and the time axis with 5-year intake age adjustment (y-axis). The hazard ratio estimates with their 95 percent confidence intervals range from 0.8 to 1.3 in increments of 0.1 (x-axis) for the outcomes, including all cause dementia and Alzhemier disease.

Hazard ratios (95% CI) for a 1μg/m3 increase in 10-y PM2.5 and all-cause dementia or AD. All models use APOE stratification and adjustment for a priori covariates: sex, educational degree, race, and neighborhood median household income. Choice of time scale and adjustment for calendar time, intake age or birth cohort are indicated in the figure. Corresponding numeric data can be found in Table S5. Note: AD, Alzheimer disease; APOE, apolipoprotein E; CI, confidence interval.