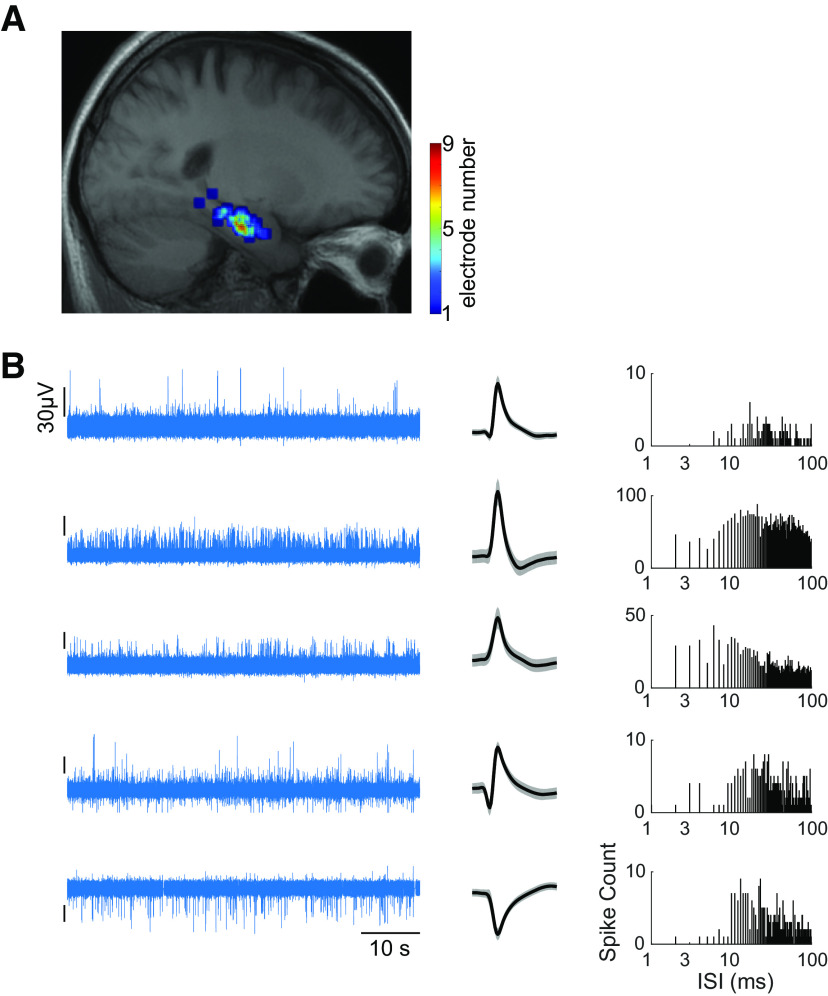
Figure 2.
A, Electrode locations shown on a sagittal slice of the average MRI of patients registered to the Montreal Neurological Institute brain template. B, Bandpass-filtered (300–3000 Hz) signal from five different channels (left), mean waveforms recorded on these channels (middle), and the corresponding distributions of interspike intervals (right). The black vertical tick marks on the left plots indicate a scale of 30 uV.

