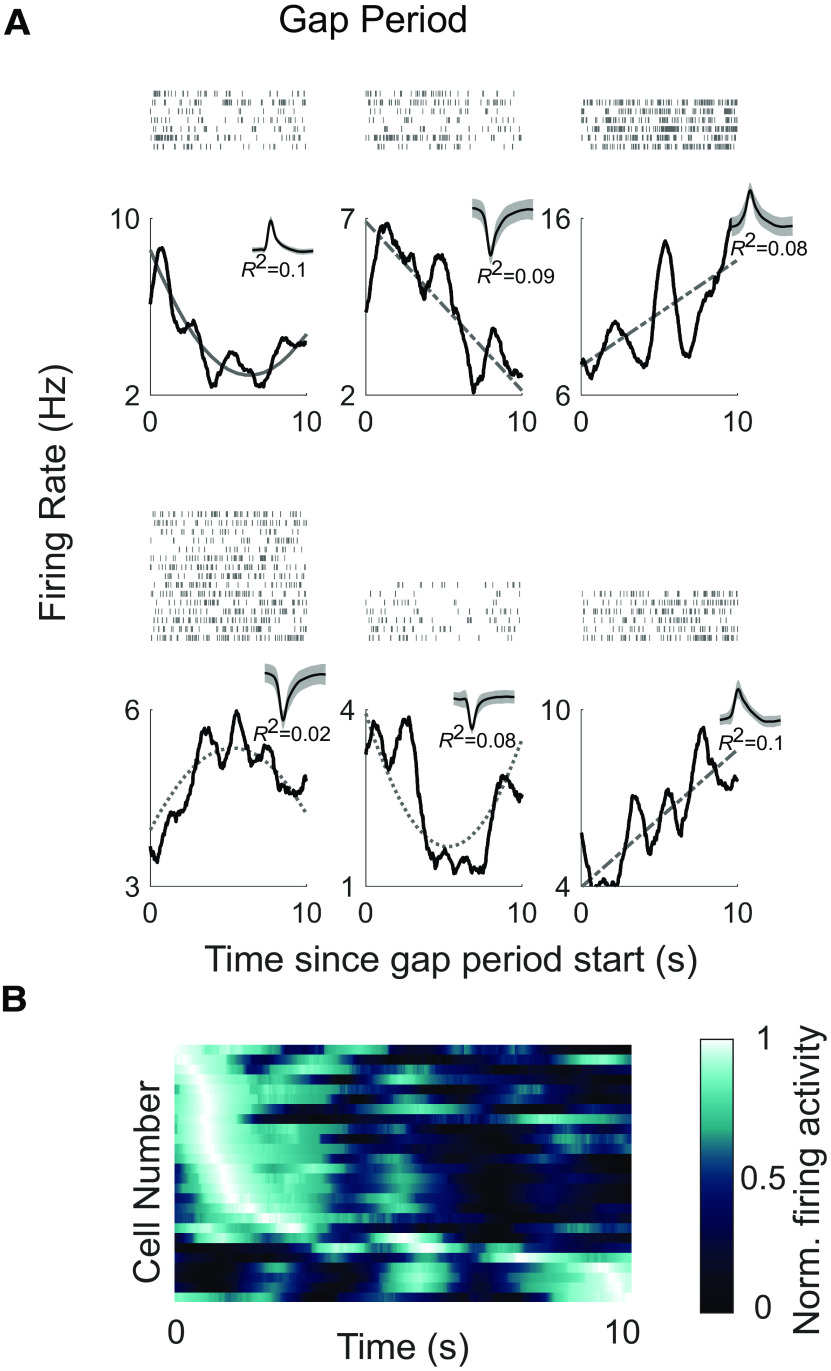
Figure 5.
Time cells fire at specific moments during the gap periods. A, Raster plots (top) and poststimulus time histograms (bottom) are shown for six example time cells. The x-axis corresponds to the 10 s duration of the gap period. The gray lines show the model fit (solid gray line for cells that were classified as time cells according to the inclusion of the linear and quadratic terms, dashed gray line for cells classified based on the linear term alone, and stippled gray line for cells classified based on the quadratic term alone). Insets, The waveforms and the R2 of the model for each cell. B, Firing activity of time cells in the temporal gap experiment (N = 26). Each row shows the firing activity for an individual cell averaged across the gap periods. The x-axis corresponds to the 10 s gap period. The neurons are sorted by the latency of the maximum firing rate.

