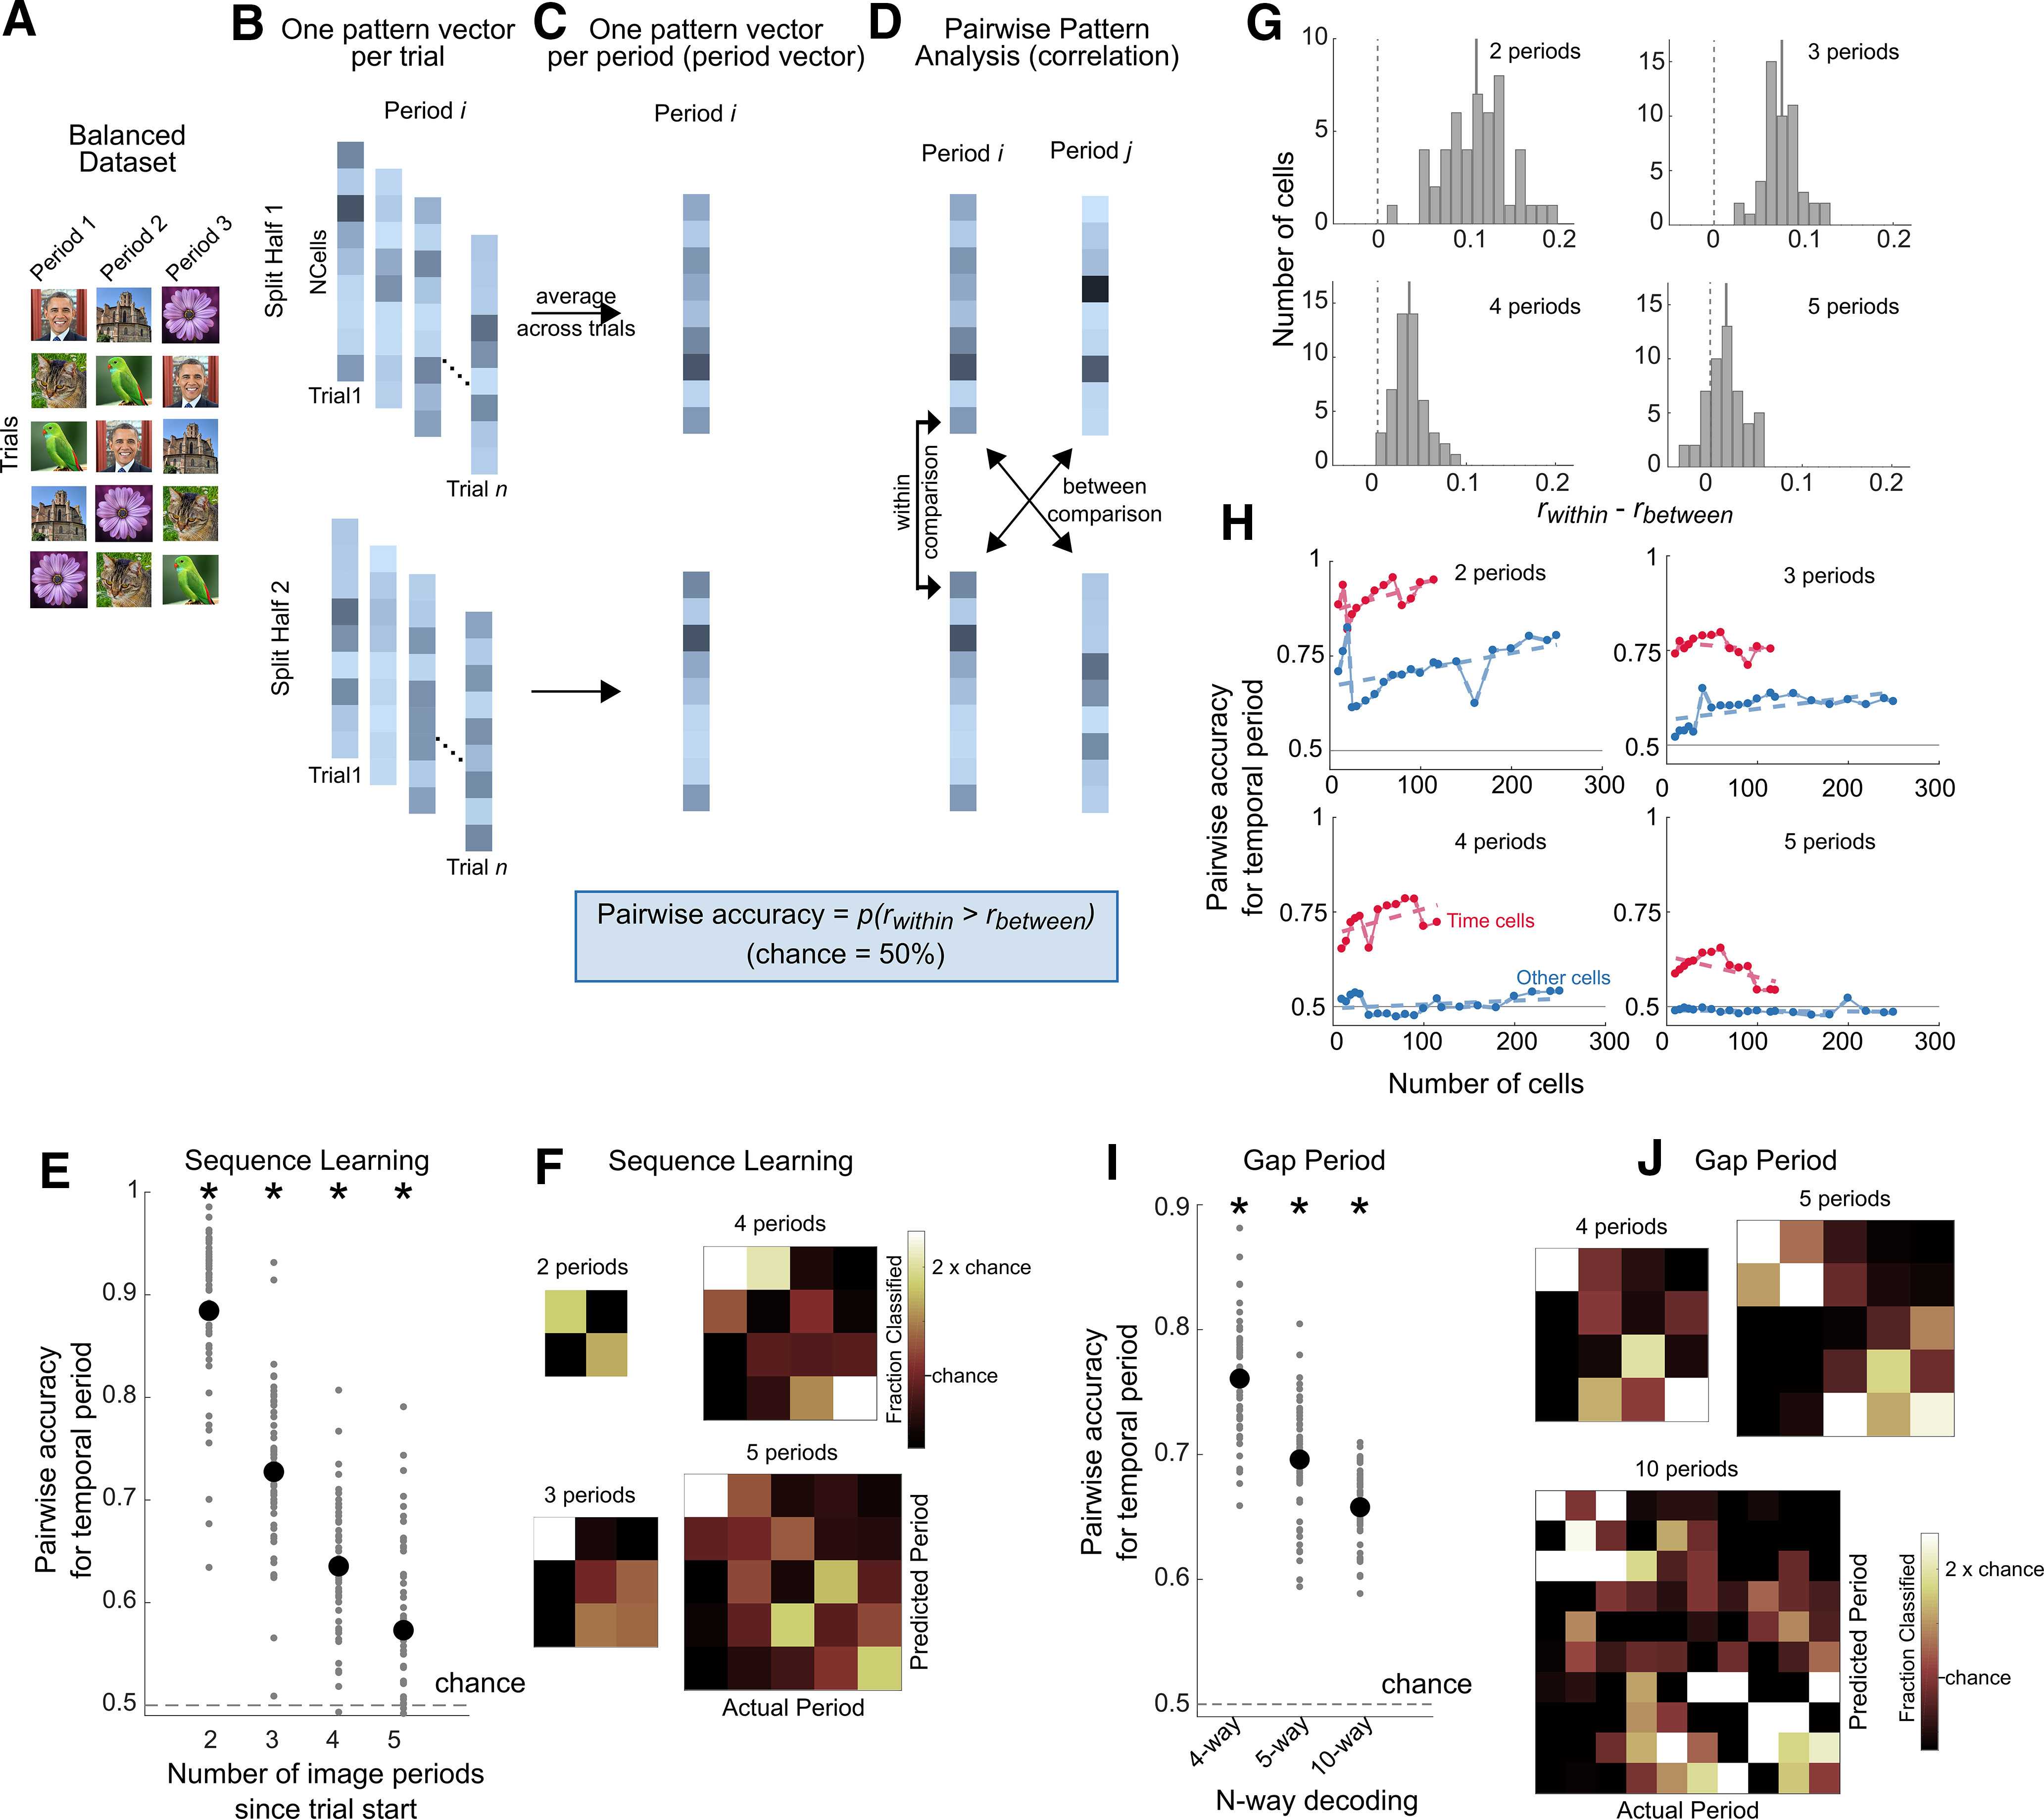
Figure 6.

Population pattern analysis. In experiment 1, the population pattern analysis was performed on image periods (e.g., discriminating image period 1 vs image period 2). In experiment 2, the population pattern analysis was performed on the 10 s gap interval. Because this decoding method was based on pairwise comparisons, chance performance is always 50%. A, For experiment 1, a balanced dataset was created by selecting a subset of trials so that each image was equally present in each period across trials (see above, Materials and Methods). B, Population pattern analysis procedure. The trials of the balanced dataset (experiment 1), or the gap intervals (experiment 2) were split into two halves (repeated on 200 iterations; see above, Materials and Methods). In each half of the dataset, and for each period, the firing activity of the population of cells was arranged into a pattern vector for each trial. C, An average pattern vector of population firing activity was obtained for each image period by averaging across trials (period vectors). D, Pairwise discrimination was performed on the period vectors across the two halves of the dataset. For all pairs of periods, the Pearson's correlation was computed across the two halves, and the same-period comparisons (within comparisons) were compared with the different-period (between) comparisons. Pairwise accuracy was the proportion of within comparison correlations (rwithin) that were higher than the between comparison correlations (rbetween) (Haxby et al., 2001; Pereira et al., 2018). E, Population pattern analysis accuracies. Pairwise accuracy for temporal period identity during the sequence learning experiment using the split-half procedure described in A–D (population size = 429 neurons). The x-axis shows the number of image periods that the classifier was tested on (i.e., discrimination between the first two image periods, the first three image periods, and so on from the start of the trial). Pairwise accuracy (mean ± SE) for discriminating the first two periods = 88.4 ± 8%, the first three periods = 72.7 ± 8%, the first four periods = 63.5 ± 6%, the first five periods = 57.3 ± 9%. The black dots correspond to the mean accuracy across the 50 iterations for creating the balanced dataset, and the gray dots show the distribution of accuracies obtained across iterations. Asterisks denote significance based on a t test against chance, (p < 10−3). As the analysis is based on pairwise comparisons, chance performance is always 50%. F, Decoding errors mainly occurred for predicting neighboring temporal periods. Confusion matrices during sequence learning when discriminating the first two temporal periods, the first three temporal periods, and so on. G, Distributions of the difference of (rwithin) and (rbetween) for decoding of the first two image periods, the first three image periods, and so on. The solid gray line corresponds to the mean of the distribution. H, Pairwise accuracy for size-matched populations of time cells (in red) and other (nontime) cells (in blue), for decoding of the first two image periods, the first three image periods, and so on. The dashed lines correspond to a linear fit through the data. The horizontal gray line corresponds to chance performance (50%). I, Population pattern analysis performance during the temporal gap experiment (population size = 96 neurons). The 10 s gap periods were split into 4, 5, or 10 discrete periods, and discrimination of temporal period identity was computed using the procedure shown in B–D. Pairwise accuracy was significantly above chance for all comparisons [t test against chance (0.5), p < 10−3]. Pairwise accuracy, mean ± SD = 76.0 ± 4.7% for four-way decoding, 69.6 ± 4.6% for five-way decoding, and 65.7 ± 3.1% for 10-way decoding. The black dots correspond to the mean accuracy across the 50 iterations for creating the balanced dataset, and the gray dots show the distribution of accuracies obtained across iterations. Asterisks denote significance based on a t test against chance (p < 10−3). Because the analysis is based on pairwise comparisons, chance performance is always 50%. J, Confusion matrix for the gap experiment for different epoch lengths.
