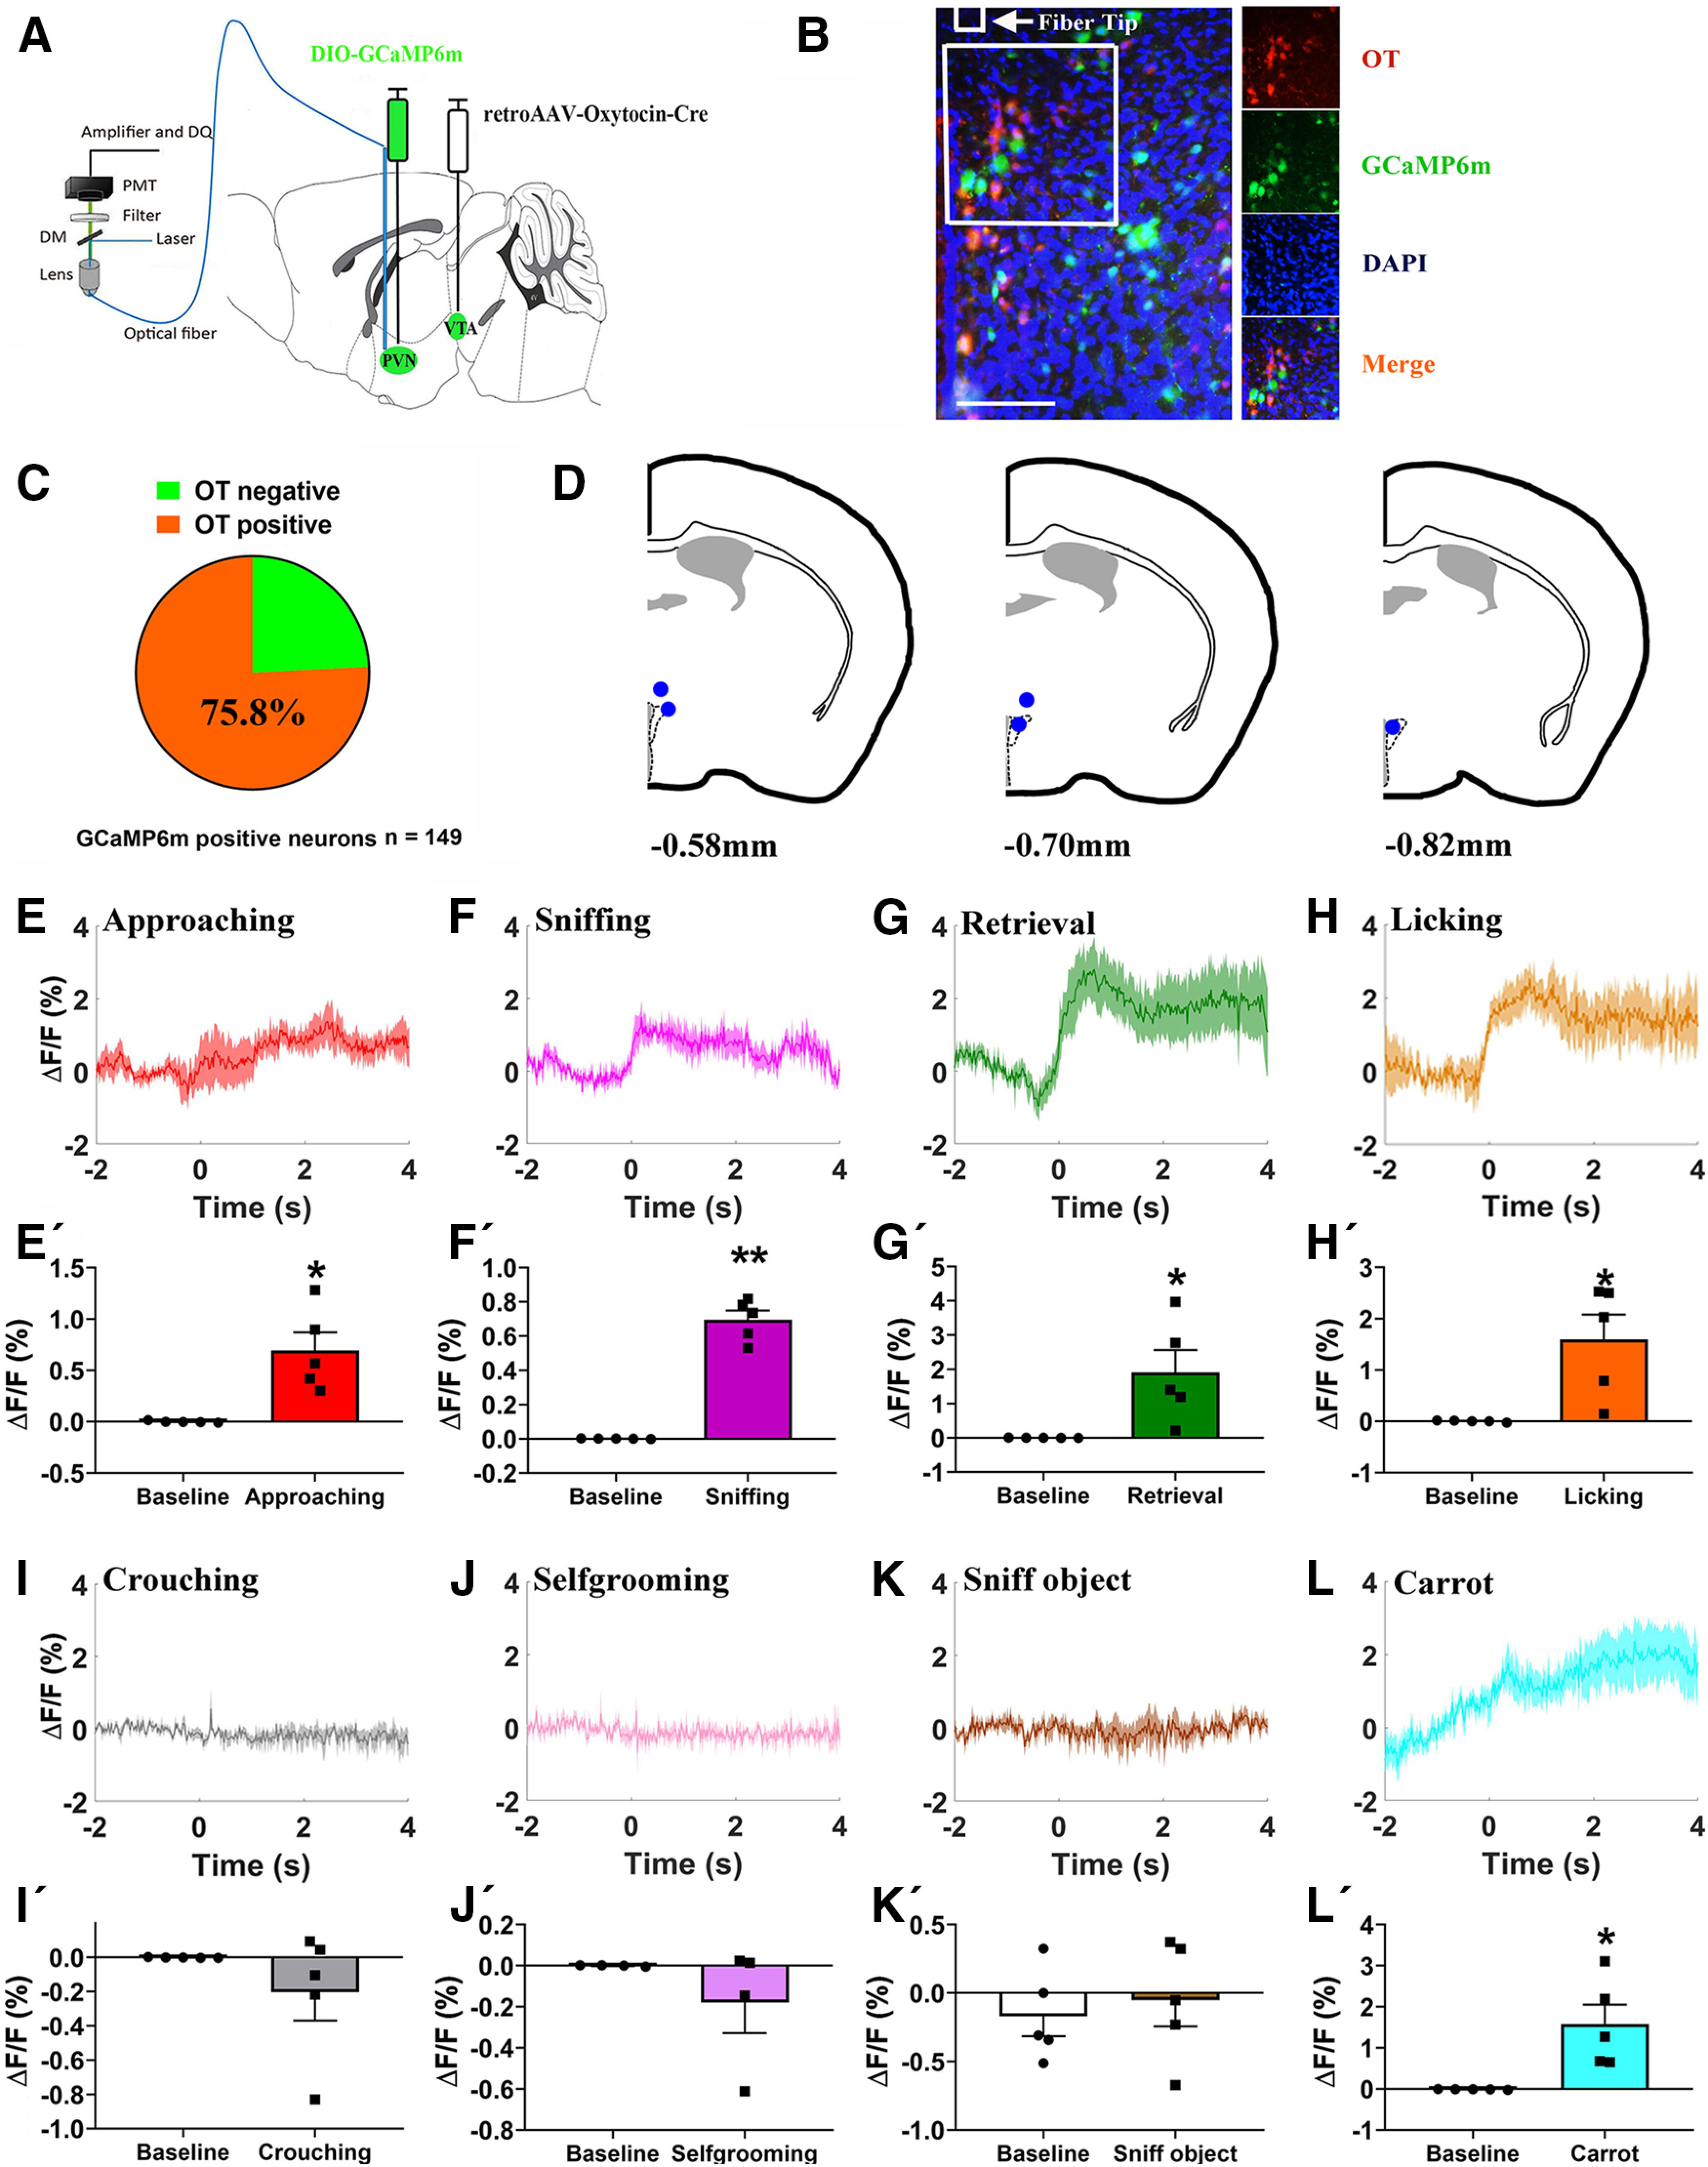
Figure 2.

Paternal behaviors and carrot consumption evoked activation of VTA projecting PVN OT neuron. A, Schematic of viral injection and optical fiber implantation above the PVN. B, Co-localization of immunoreactive GCaMP6m (green), OT (red), and DAPI (blue) and the optical fiber location in the PVN. Scale bar: 100 μm. C, Statistical chart showed that GCaMP6m was relatively restricted to OT-positive neurons (n = 2). D, Schematic diagrams showing the target of fiber tip placements in the PVN. E–L, Average △F/F during various paternal behaviors: (E) approaching, (F) sniffing, (G) retrieval, (H) grooming, (I) crouching, (J) selfgrooming, (K) sniff object, and (L) approaching/eating carrot. E'–L', Comparison of average calcium signal for –2–0 and 0–4 s after various paternal behaviors: (E') approaching (t(4) = −3.932, p = 0.017), (F') first sniffing (t(4) = −13.084, p < 0.001), (G') retrieval (t(4) = −2.905, p = 0.044), (H') grooming (t(4) = −3.332, p = 0.0290), (I') crouching (t(4) = 1.216, p = 0.291), (J') selfgrooming (t(3) = 1.220, p = 0.310), (K') sniff object (t(4) = −0.429, p = 0.690), and (L') approaching/eating carrot (t(4) = −3.358, p = 0.028); n = 4–5. Paired t test; *p < 0.05, **p < 0.01. Data are mean ± SEM.
