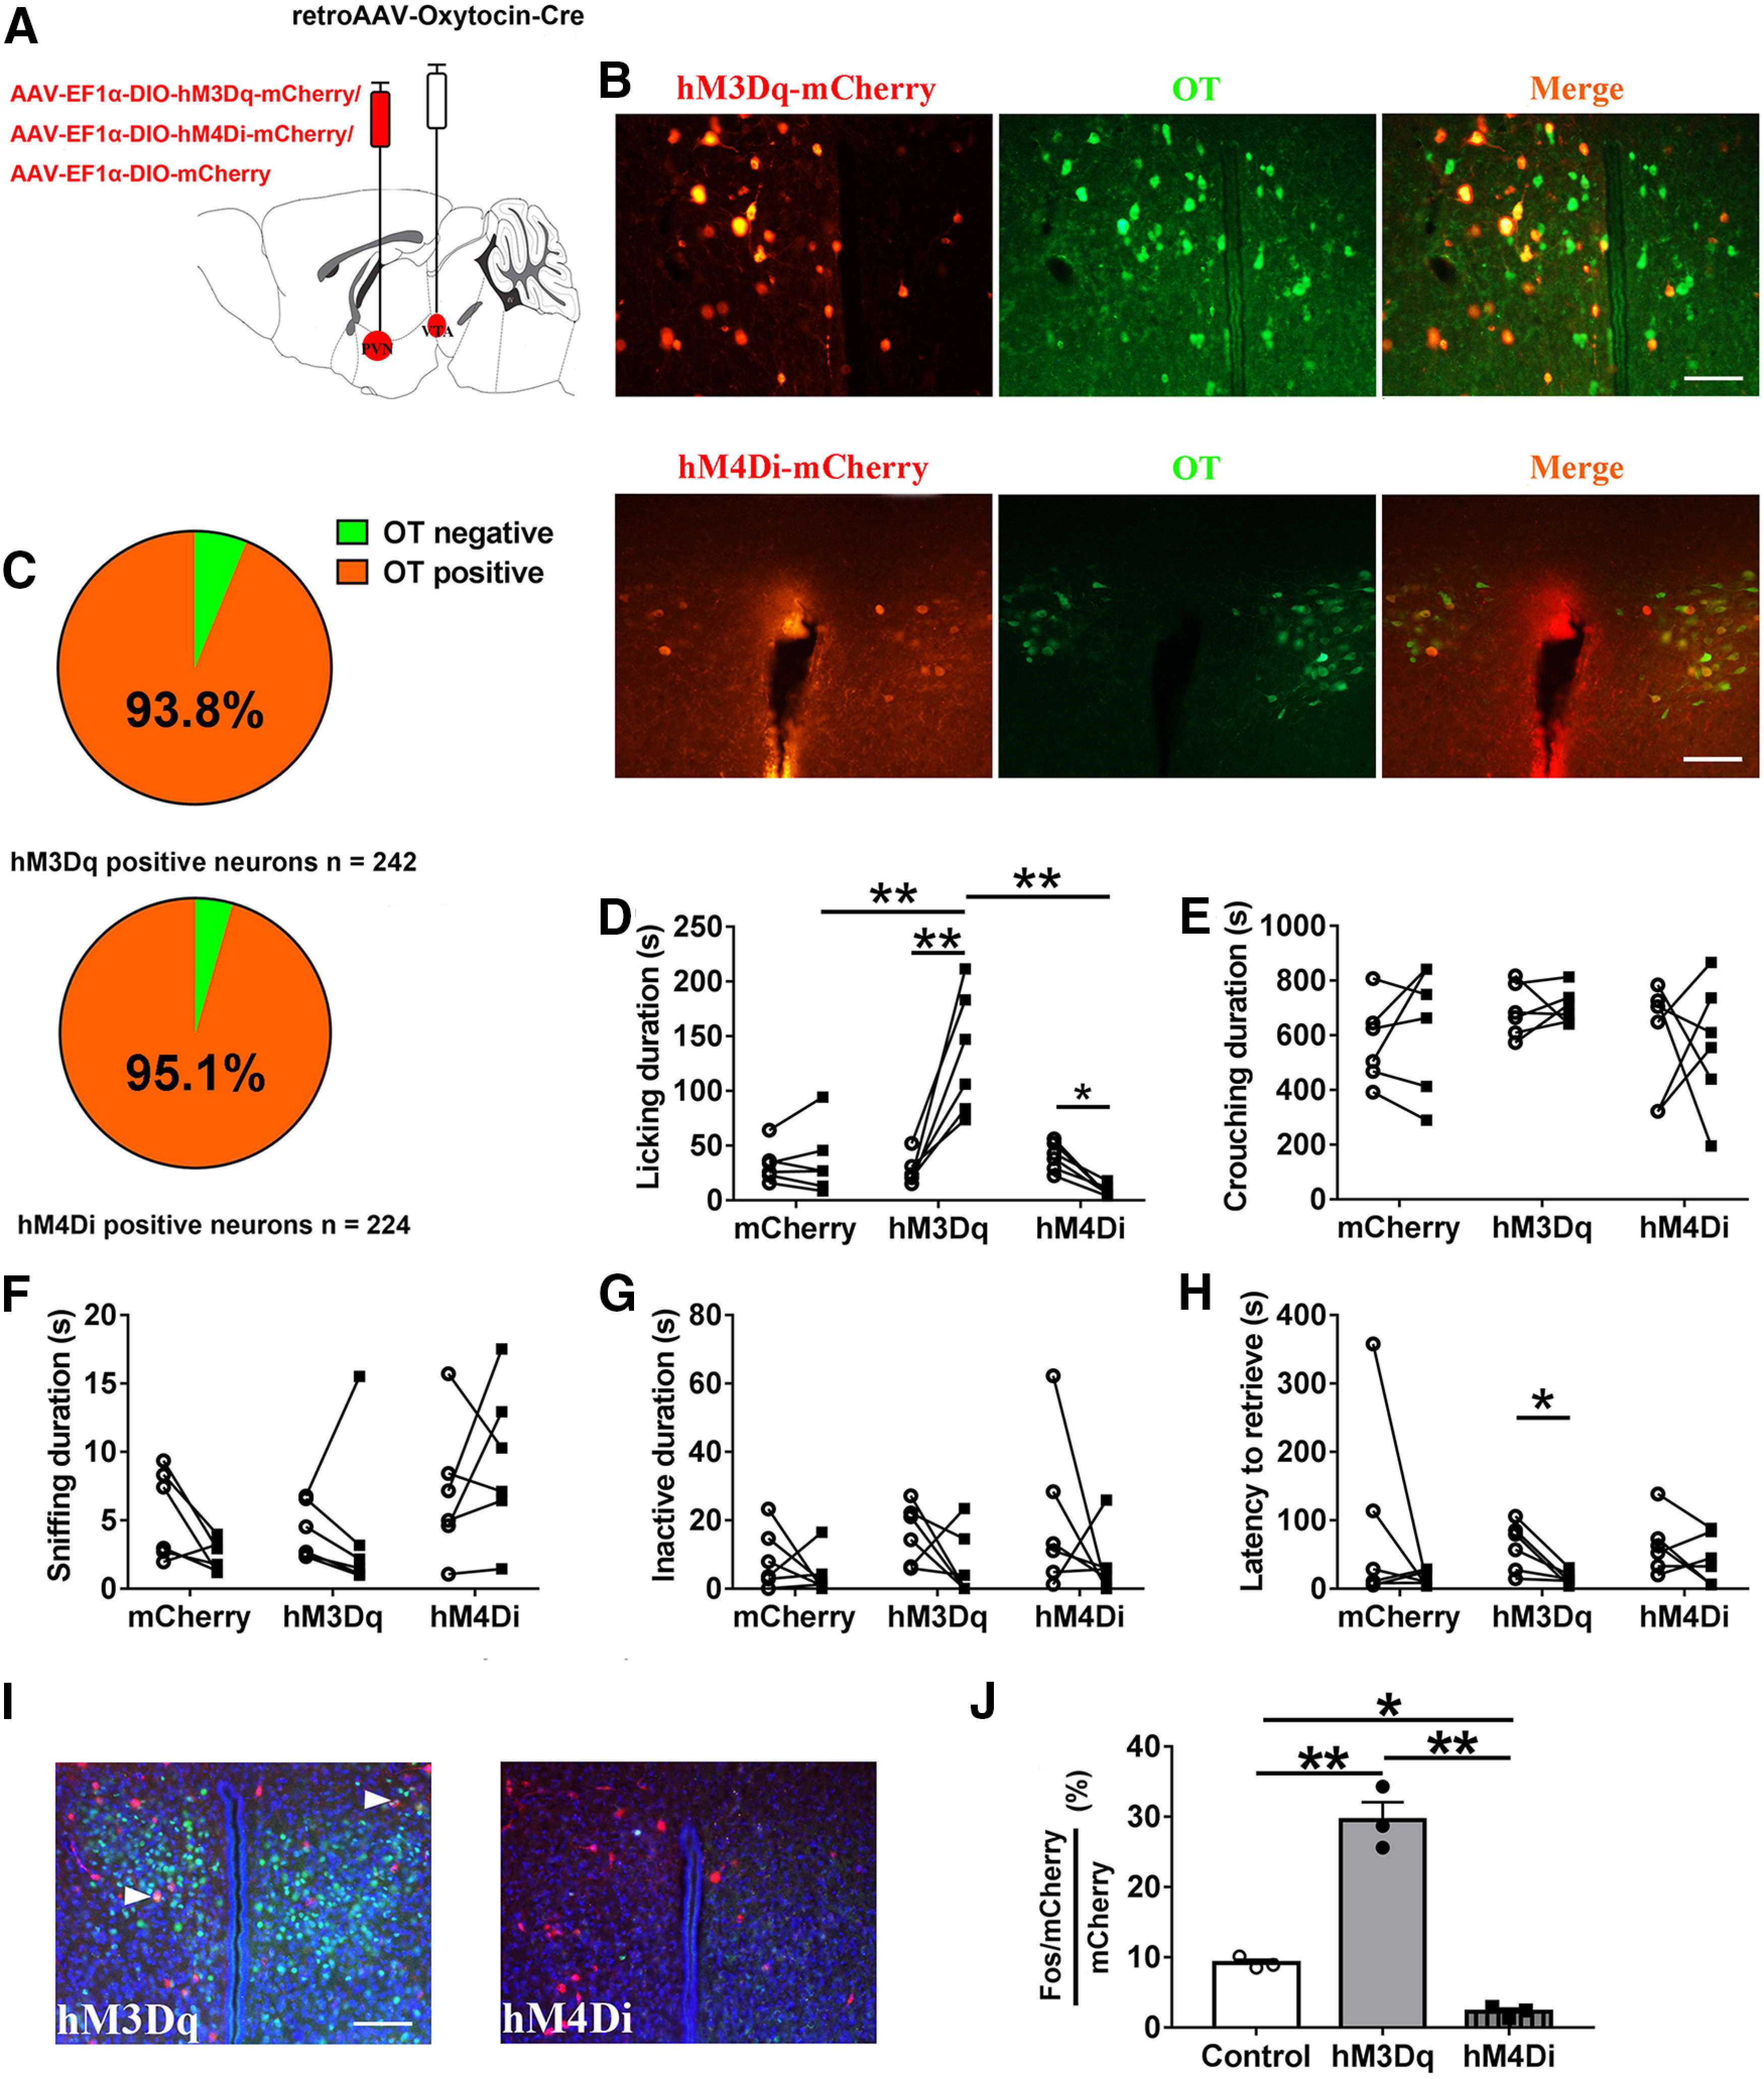
Figure 3.

Influences of chemogenetic activation/inhibition of the PVN to VTA OT circuit on paternal behaviors. A, Schematic of AAV injection. B, Confocal image depicting OT immunostaining (green), hM3Dq-mCherry/hM4Di-mCherry immunostaining (red), and DAPI (blue) in the PVN. Scale bar: 100 μm. C, Statistical chart showed that hM3Dq-mCherry (n = 2) or hM4Di-mCherry neurons (n = 2) were relatively restricted to OT-positive cells. D–H, Effects of chemogenetic activation (hM3Dq) or inhibition (hM4Di) of PVN OT neurons projecting to VTA on the duration of (D) licking/grooming (interaction: F(2,15) = 27.447, p < 0.001, post hoc test: mCherry saline vs CNO, p = 0.850; hM3Dq saline vs CNO, p < 0.001; hM4Di saline vs CNO, p = 0.035; saline mCherry vs hM3Dq, p = 0.866; saline mCherry vs hM4Di, p = 0.801; saline hM3Dq vs hM4Di, p = 0.370; CNO mCherry vs hM3Dq, p = 0.001; CNO mCherry vs hM4Di, p = 0.522; CNO hM3Dq vs hM4Di, p < 0.001), (E) crouching (interaction: F(2,15) = 0.152, p = 0.861; treatment: F(1,15) = 0.114, p = 0.740; group: F(2,15) = 1.480, p = 0.259), (F) sniffing pup (interaction: F(2,15) = 1.982, p = 0.172; treatment: F(1,15) = 0.077, p = 0.785; group: F(2,15) = 2.832, p = 0.091), (G) inactivity (interaction: F(2,15) = 0.276, p = 0.763; treatment: F(1,15) = 3.454, p = 0.083; group: F(2,15) = 1.836, p = 0.194), and (H) the latency to retrieve a pup (interaction: F(2,15) = 0.548, p = 0.590; treatment: F(1,15) = 4.969, p = 0.042, hM3Dq saline vs CNO, paired t test: t(5) = 3.390, p = 0.019; group: F(2,15) = 0.193, p = 0.827). Sample sizes are n = 6 for each group. Data were analyzed by two-way ANOVA with repeated measures; *p < 0.05, **p < 0.01. Data are mean ± SEM. I, Representative images of the PVN illustrating c-Fos in neurons expressing hM3Dq-mCherry. Scale bar: 100 μm. J, Percentage of mCherry+ neurons that were also Fos+ in the PVN after CNO injection (n = 3; F(2,6) = 87.264, p < 0.001, post hoc test: control vs hM3Dq, p < 0.001; control vs hM4Di, p = 0.041; hM3Dq vs hM4Di, p < 0.001). One-way ANOVA; *p < 0.05, **p < 0.01. Data are mean ± SEM.
