
Figure 4.
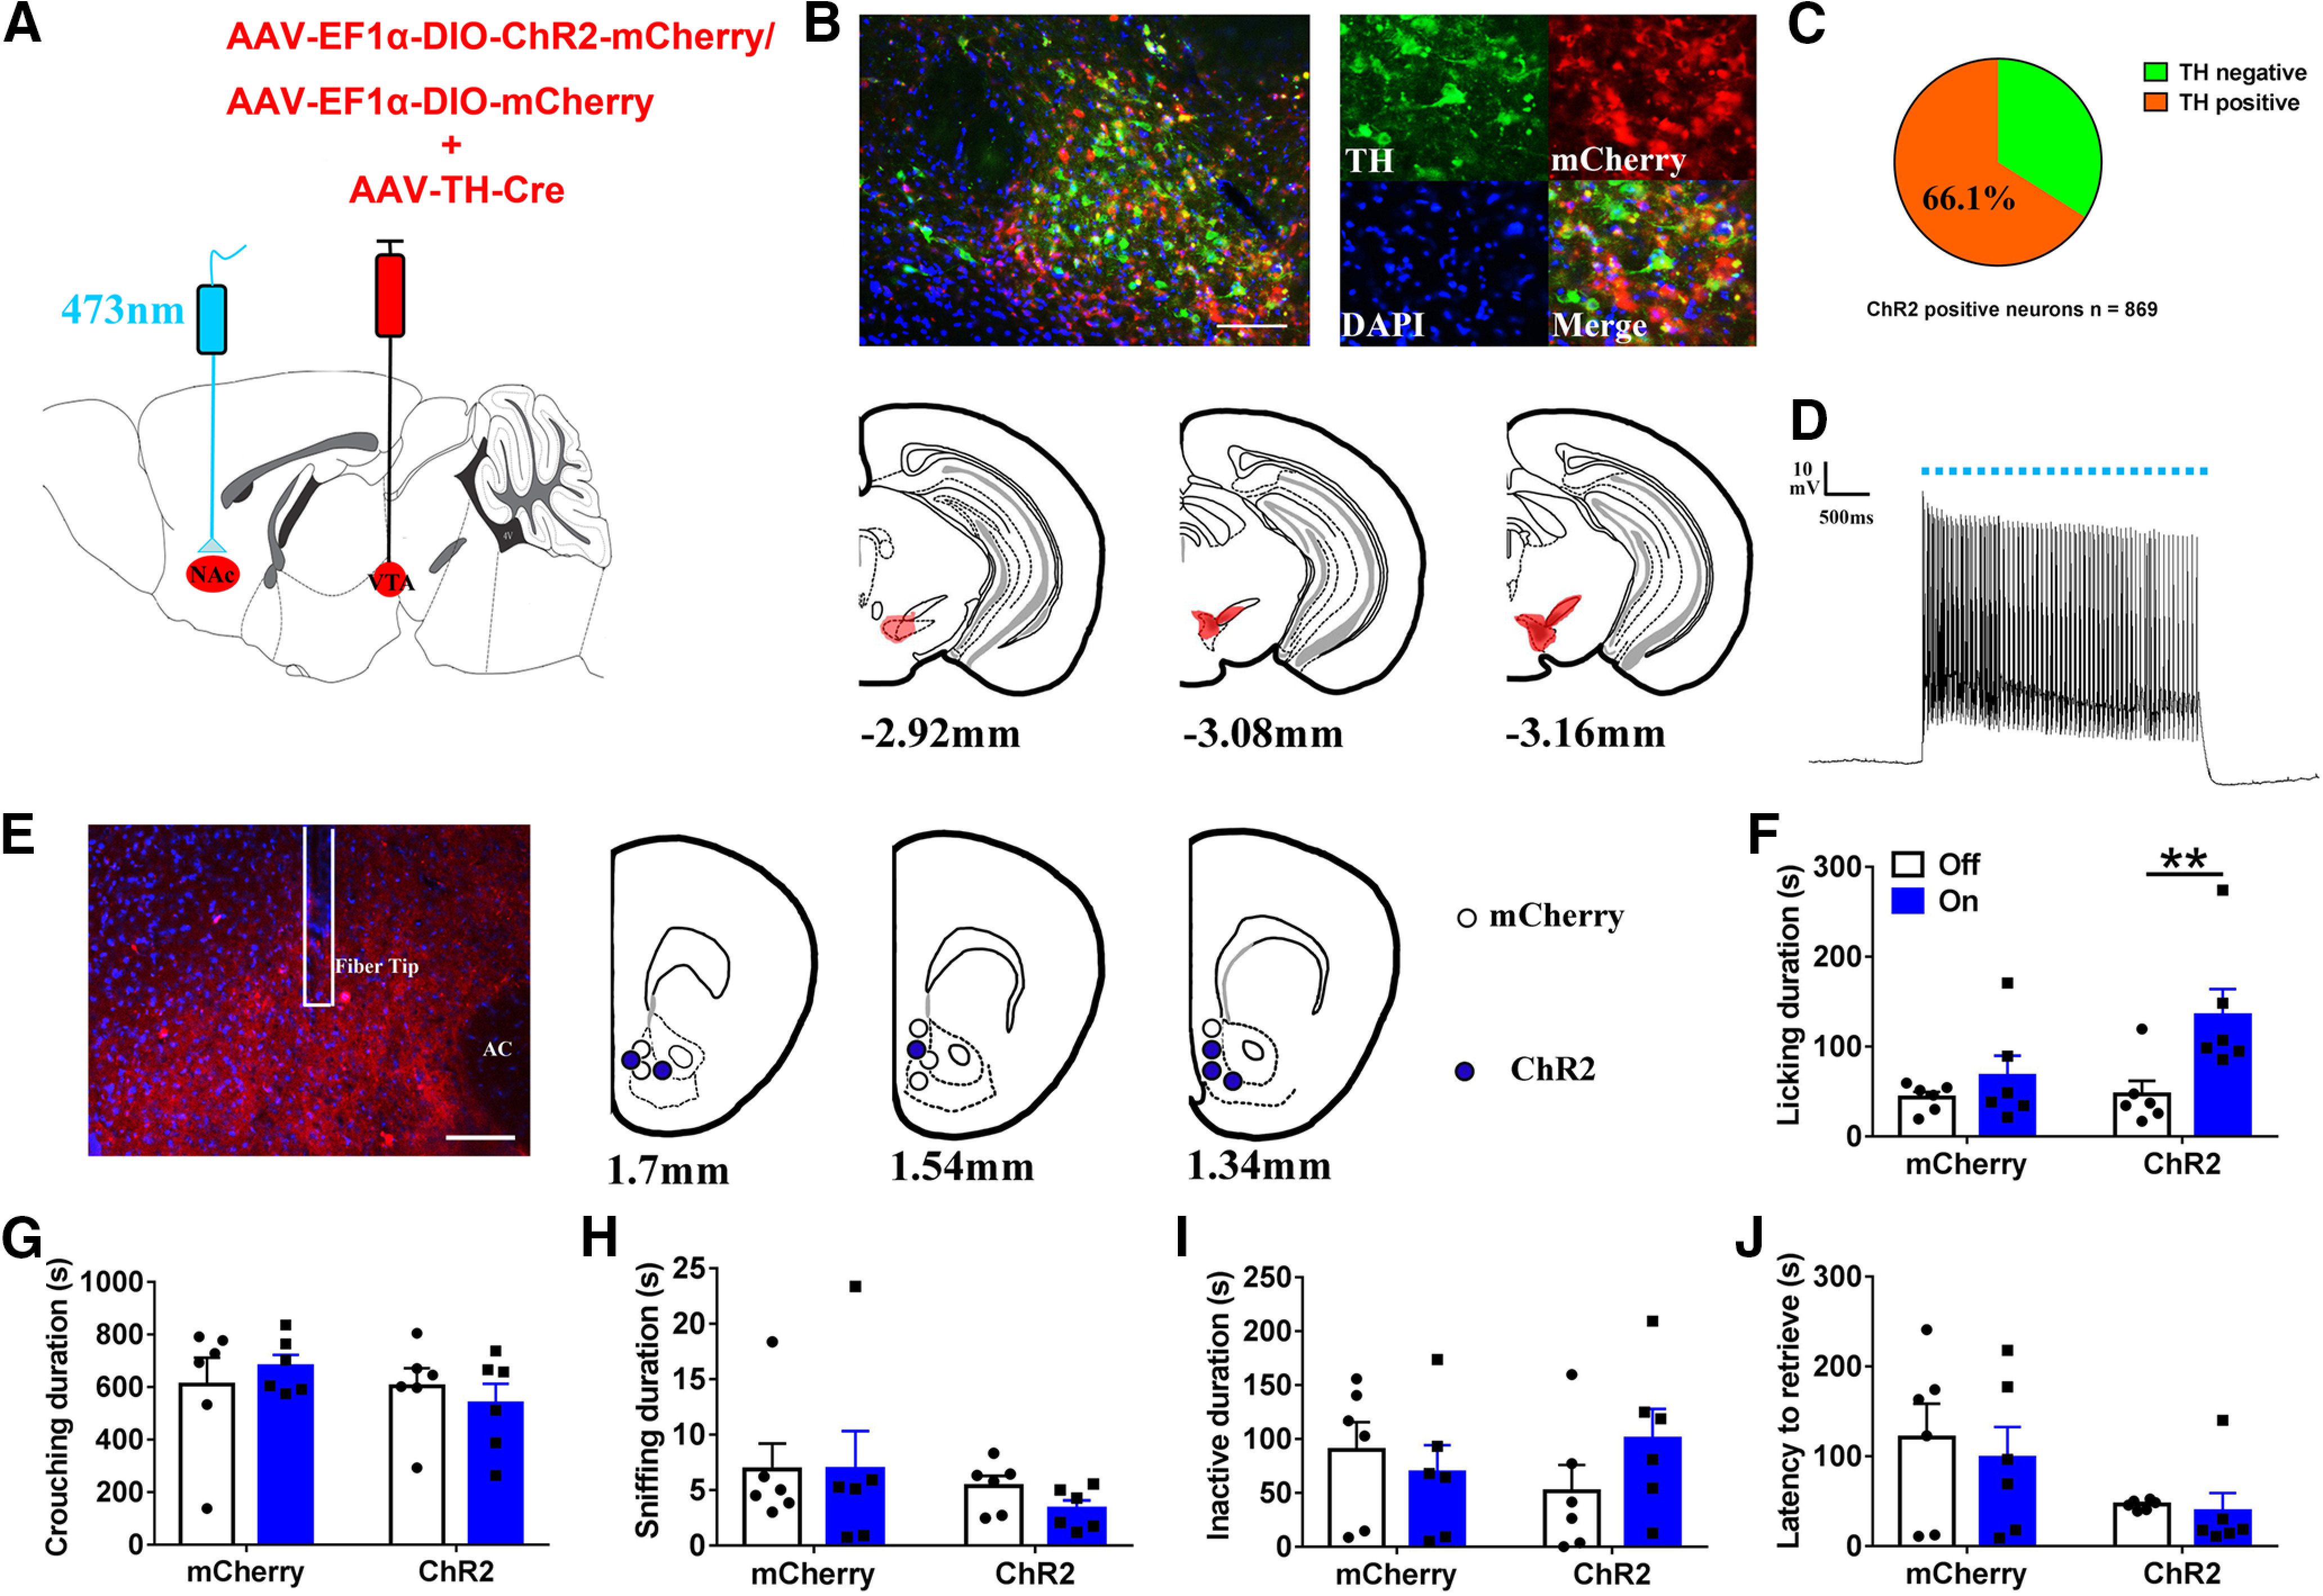
Optogenetic activation of VTA-originating DA terminals in NAc increased licking and grooming of fathers for own pups. A, Schematic of viral strategy and optical fiber implantation above the NAc. B, Overlap of TH immunoreactivity (green), ChR2 expression (red), and DAPI (blue) in the VTA (up); schematic representations of the viral injection spread in the VTA (down). Scale bar: 100 μm. C, Statistical chart showed that ChR2-mCherry was relatively restricted to TH-positive cells (n = 2). D, Optical stimulation evoke action potentials of a ChR2-expressing neuron in the VTA. E, Confocal image showing axonal mCherry signal and the optical fiber track in the NAc. Scale bar: 100 μm. AC: anterior commissure. F–J, Effect of activating the VTA to NAc DA pathways on the total of time spent on (F) licking/grooming (interaction: F(1,10) = 5.459, p = 0.042, post hoc test: ChR2 off vs on, p = 0.001; mCherry off vs on, p = 0.250; light off ChR2 vs mCherry, p = 0.839; light on ChR2 vs mCherry, p = 0.098), (G) crouching (interaction: F(1,10) = 0.753, p = 0.406; treatment: F(1,10) = 0.001, p = 0.980; group: F(1,10) = 1.047, p = 0.330), (H) sniffing (interaction: F(1,10) = 0.216, p = 0.652); treatment: F(1,10) = 0.195, p = 0.668; group: F(1,10) = 1.487, p = 0.251), (I) inactivity (interaction: F(1,10) = 2.766, p = 0.127; treatment: F(1,10) = 0.439, p = 0.522; group: F(1,10) = 0.014, p = 0.907), and (J) the latency to retrieve a pup (interaction: F(1,10) = 0.008, p = 0.929; treatment: F(1,10) = 0.116, p = 0.741; group: F(1,10) = 2.567, p = 0.140). mCherry (n = 6), ChR2-mCherry (n = 6). Two-way ANOVA with repeated measures; **p < 0.01. Error bars indicate SEM.