
Figure 6.
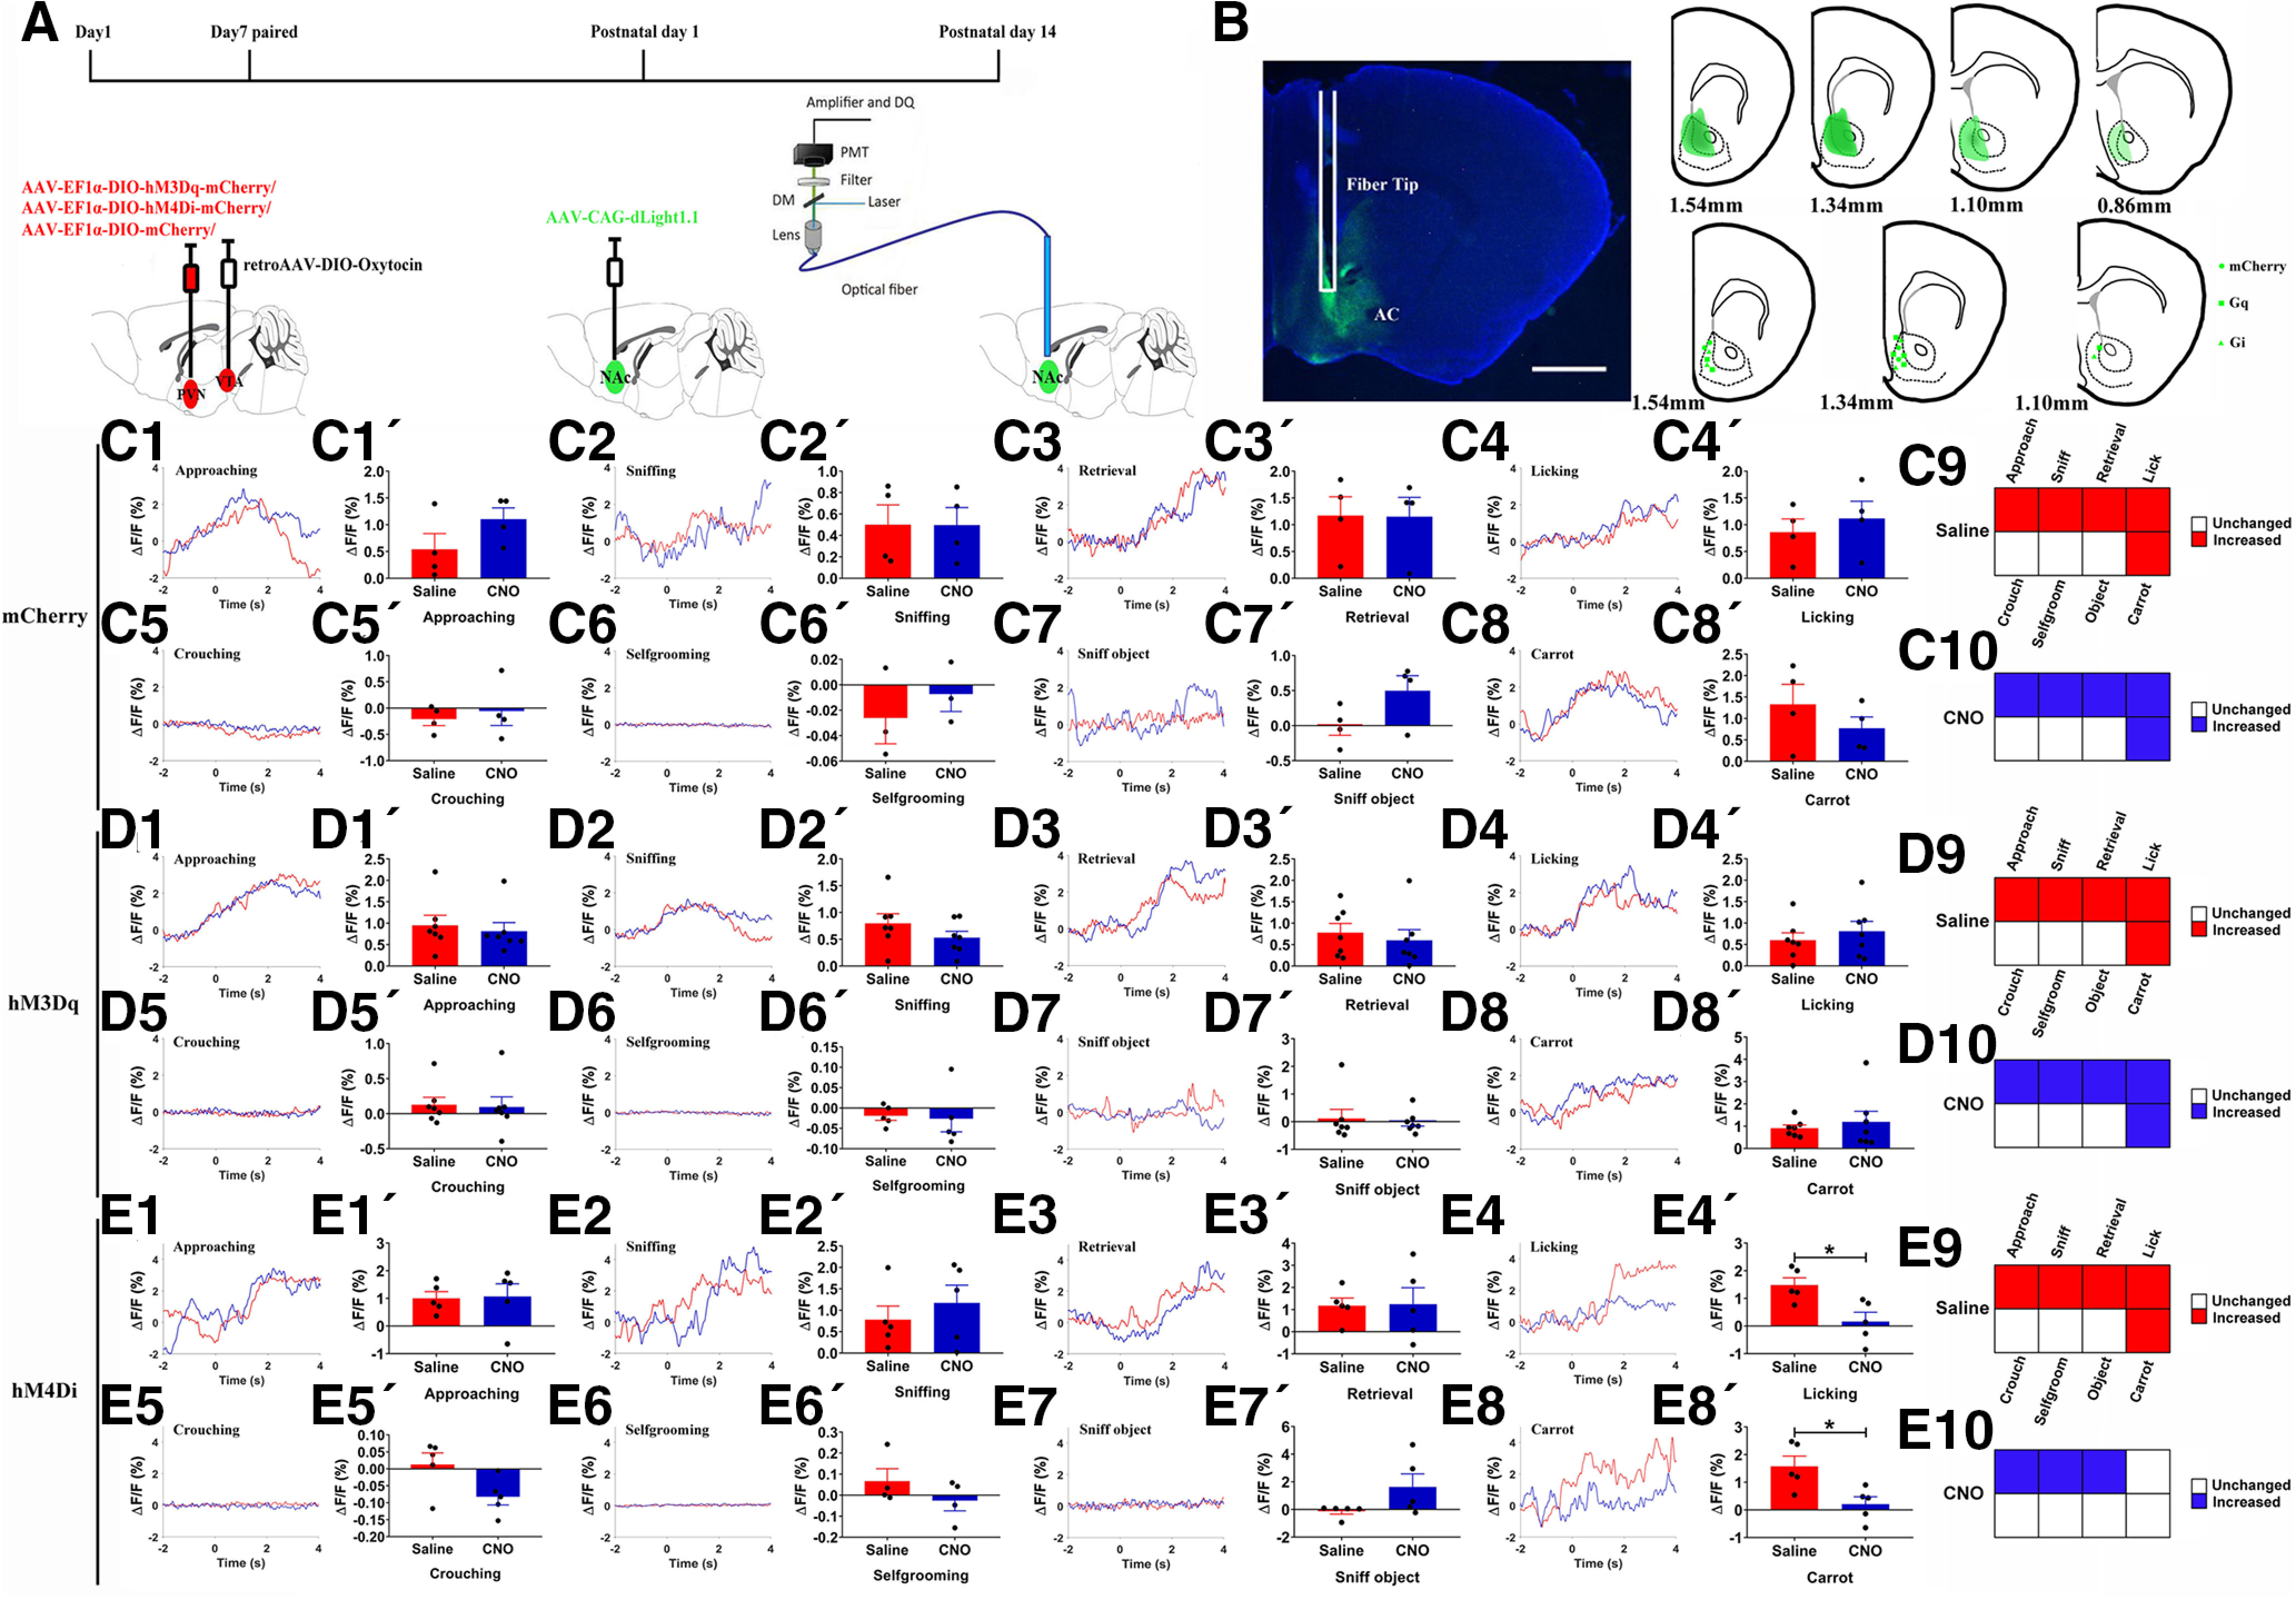
Chemogenetic activation/inhibition of PVN-NAc projections influenced DA release in the NAc simultaneously on paternal behaviors. A, Experimental design. B, dLight1.1 expression and fiber tips location in the NAc (left), schematic representations of the viral injection spread in the NAc (right). Scale bar: 1 mm. C1–E8, Representative traces showing DA signal changes aligned to onsets of various paternal behaviors (C1–C5, D1–D5, E1–E5), selfgrooming (C6, D6, E6), sniff object (C7, D7, E7), or approach/eating carrot (C8, D8, E8). 1 = approach, 2 = first sniff own pups, 3 = retrieval, 4 = licking, 5 = crouching, 6 = selfgrooming, 7 = sniff object, 8 = carrot. C1'–E8', Mean △F/F during approaching (mCherry: t(3) = −1.548, p = 0.219; Gq: t(6) = 0.430, p = 0.682; Gi: t(4) = −0.099, p = 0.926; C1', D1', E1'), first sniff own pups (mCherry: t(3) = 0.012, p = 0.991; Gq: t(6) = 1.096, p = 0.315; Gi: t(4) = −0.593, p = 0.585; C2', D2', E2'), retrieval (mCherry: t(3) = 0.095, p = 0.931; Gq: t(6) = 0.861, p = 0.422; Gi: t(4) = −0.076, p = 0.943; C3', D3', E3'), licking (mCherry: t(3) = −1.122, p = 0.344; Gq: t(6) = −1.179, p = 0.283; Gi: t(4) = 4.341, p = 0.012; C4', D4', E4'), crouching (mCherry: t(3) = −0.702, p = 0.533; Gq: t(6) = 0.155, p = 0.882; Gi: t(4) = 2.619, p = 0.059; C5', D5', E5'), selfgrooming (mCherry: t(2) = −0.661, p = 0.577; Gq: t(4) = 0.234, p = 0.826; Gi: t(3) =1.758, p = 1.777; C6', D6', E6'), sniff object (mCherry: t(3) = −1774, p = 0.174; Gq: t(6) = 0.353, p = 0.736; Gi: t(4) = −1.946, p = 0.124; C7', D7', E7'), or approach/eating carrot (mCherry: t(3) = 1.814, p = 0.167; Gq: t(6) = −0.572, p = 0.588; Gi: t(4) = 2.841, p = 0.047; C8', D8', E8') shown in all fathers. C9, C10, D9, D10, E9, E10, Tuning matrix for DA release (baseline vs signals) in mCherry (C9, C10), Gq-mCherry (D9, D10), and Gi-mCherry (E9, E10) groups, these DA changes are relative to the. mCherry: n = 3–4; Gq-mCherry: n = 5–7; Gi-mCherry: n = 4–5. Paired t test; *p < 0.05. Error bars indicate SEM.