
Figure 9.
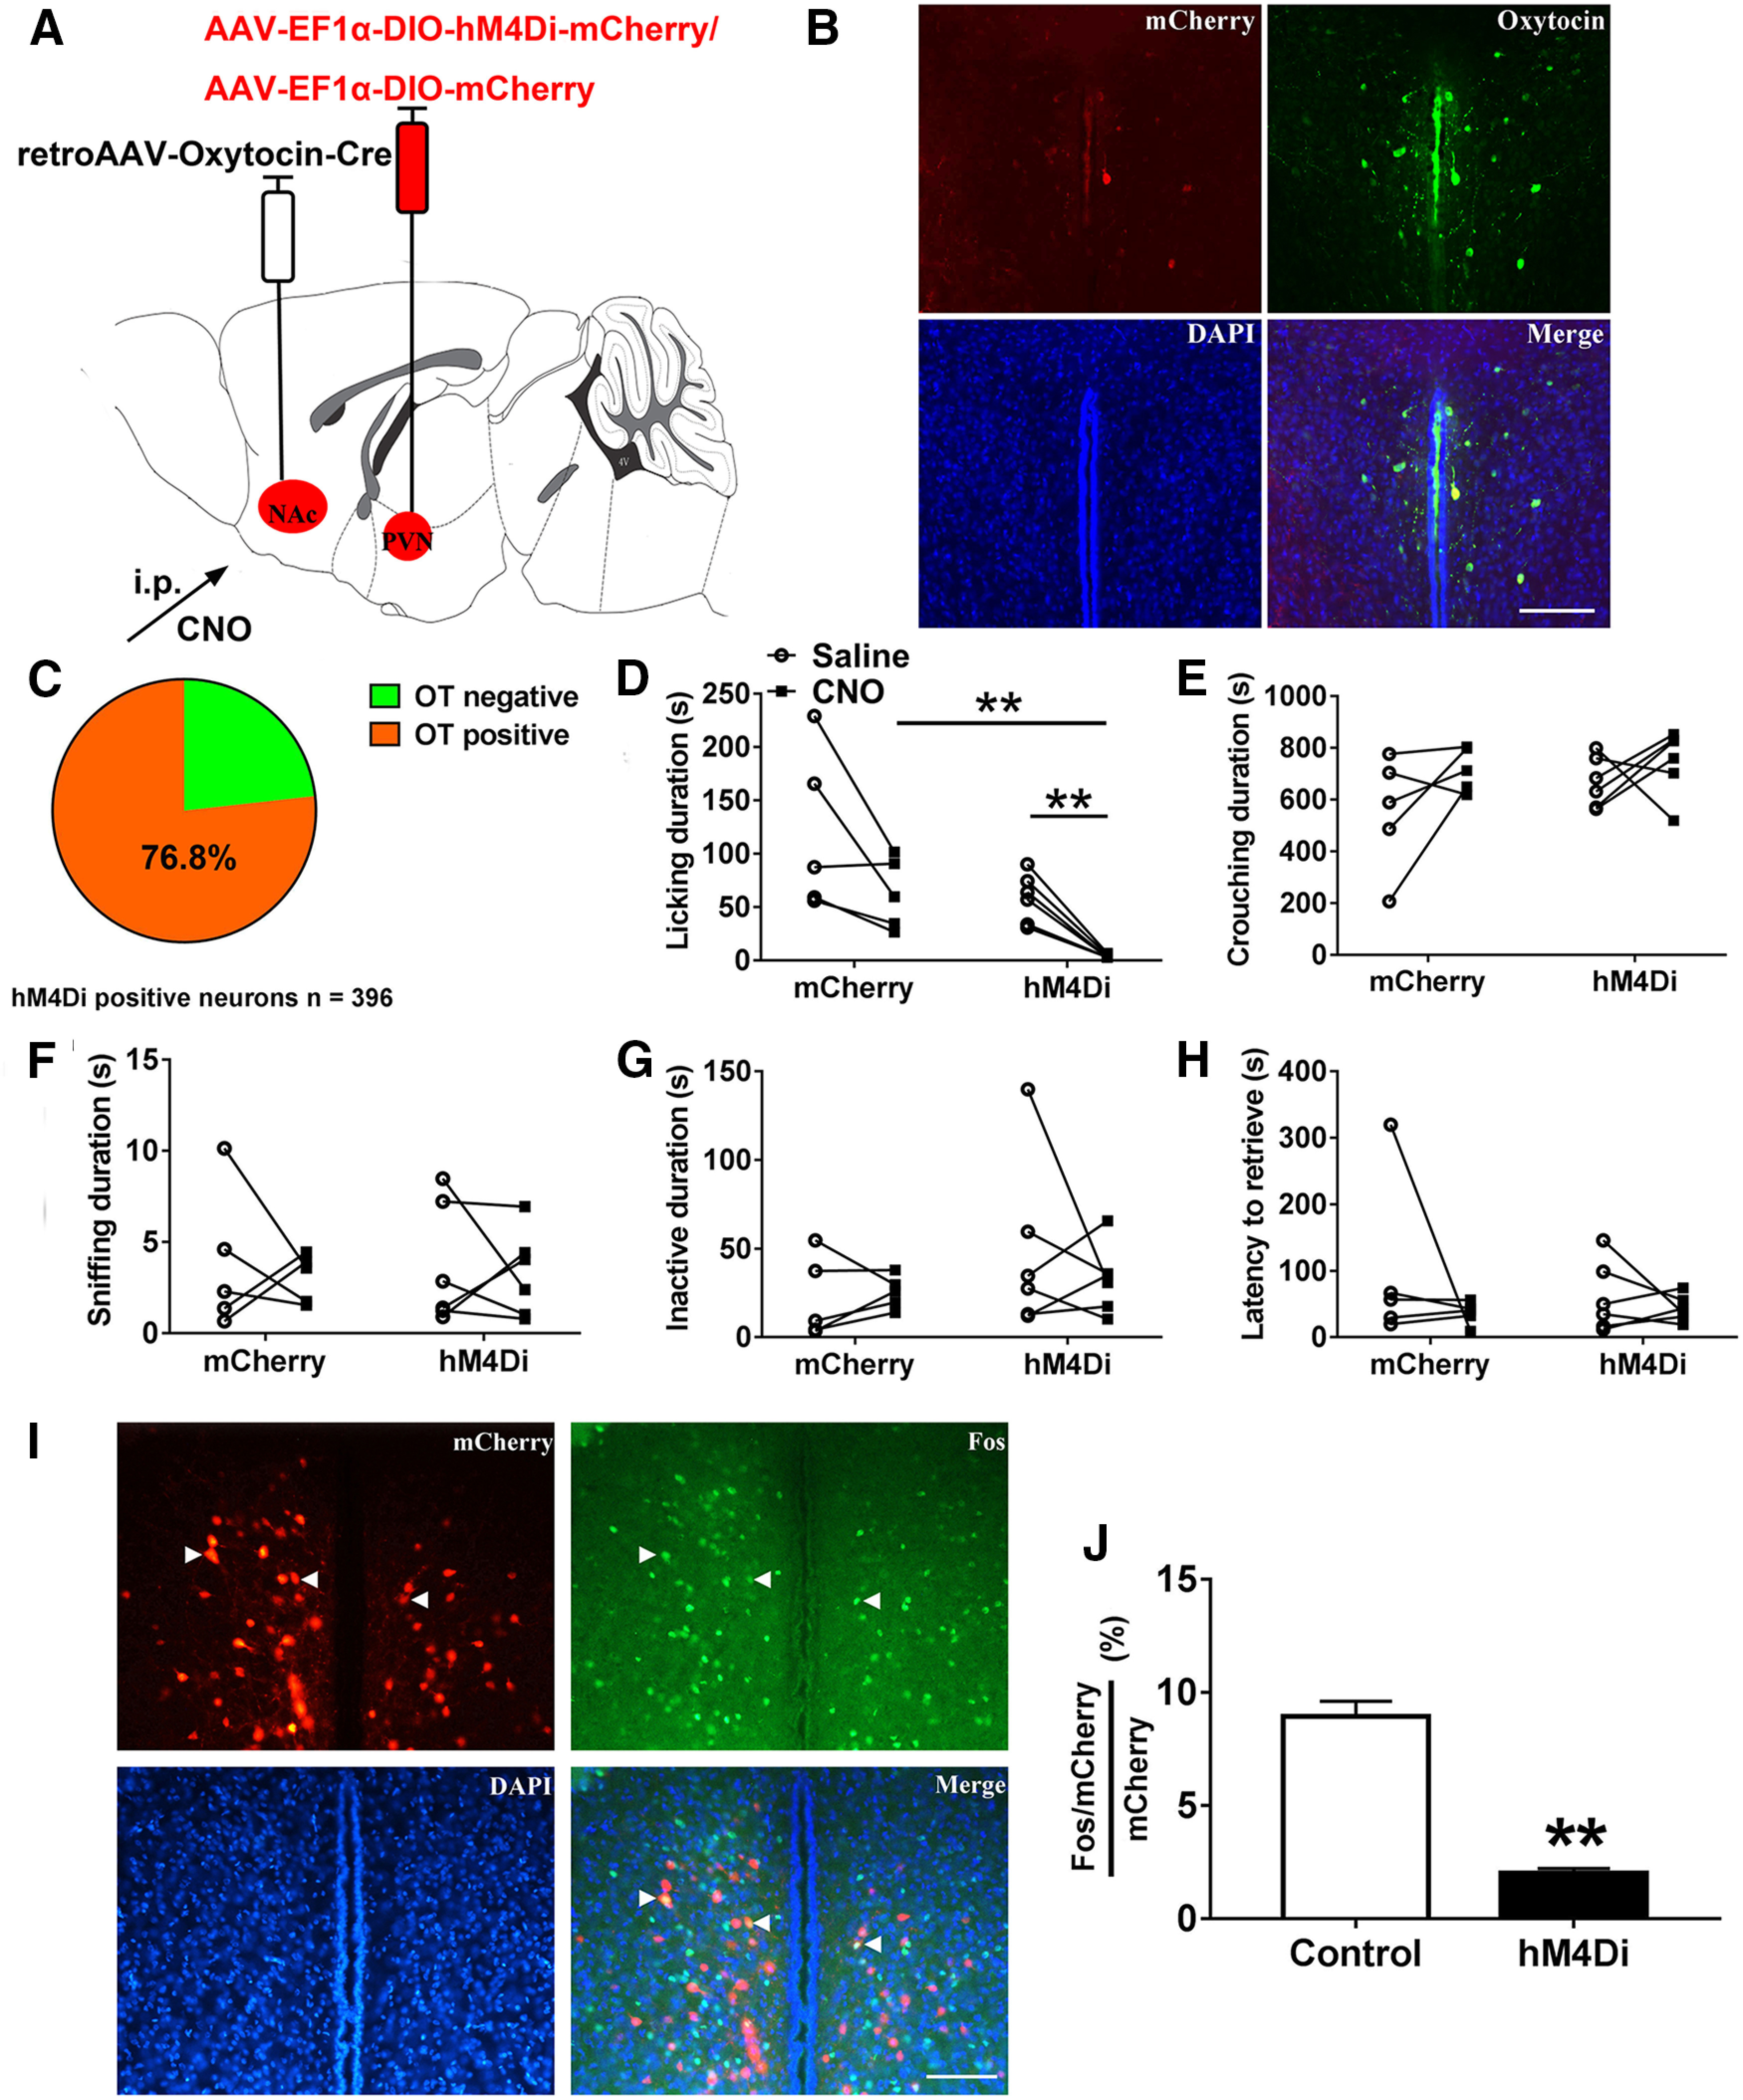
Chemogenetic inhibition of the PVN to NAc OT pathways suppresses paternal behaviors. A, Viral strategy. B, Co-localization of hM4Di expression (red), OT immunoreactivity (green), and DAPI (blue) in the PVN. Scale bar: 100 μm. C, Statistical chart showed that hM4Di-mCherry was relatively restricted to OT-positive cells (n = 2). D–H, Effect of inhibition of PVN to NAc OT pathways on the duration of (D) licking/grooming (interaction: F(1,9) = 0.011, p = 0.920; treatment: F(1,9) = 19.826, p = 0.002, t(5) = 6.087, p = 0.002; group: F(1,9) = 7.903, p = 0.020, t(9) = 4.366, p = 0.017), (E) crouching (interaction: F(1,9) = 0.431, p = 0.528; treatment: F(1,9) = 3.697, p = 0.087; group: F(1,9) = 1.719, p = 0.222), (F) sniffing pups (interaction: F(1,9) = 0.024, p = 0.881; treatment: F(1,9) = 0.270, p = 0.616; group: F(1,9) = 0.001, p = 0.973), (G) inactivity (interaction: F(1,9) = 0.616, p = 0.453; treatment: F(1,9) = 0.238, p = 0.637; group: F(1,9) = 1.510, p = 0.250), and (H) the latency to retrieve a pup (interaction: F(1,9) = 0.567, p = 0.471; treatment: F(1,9) = 1.640, p = 0.232; group: F(1,9) = 0.369, p = 0.559). mCherry (n = 5), hM4Di-mCherry (n = 6). Two-way ANOVA with for repeated measures; **p < 0.01. Data are mean ± SEM. I, Representative images of the PVN illustrating Fos in neurons expressing mCherry. Scale bar: 100 μm. J, Percentage mCherry neurons in the PVN expressing Fos after CNO injection (t(4) = 9.926, p = 0.001; n = 3). Independent t test; **p < 0.01. Data are mean ± SEM.