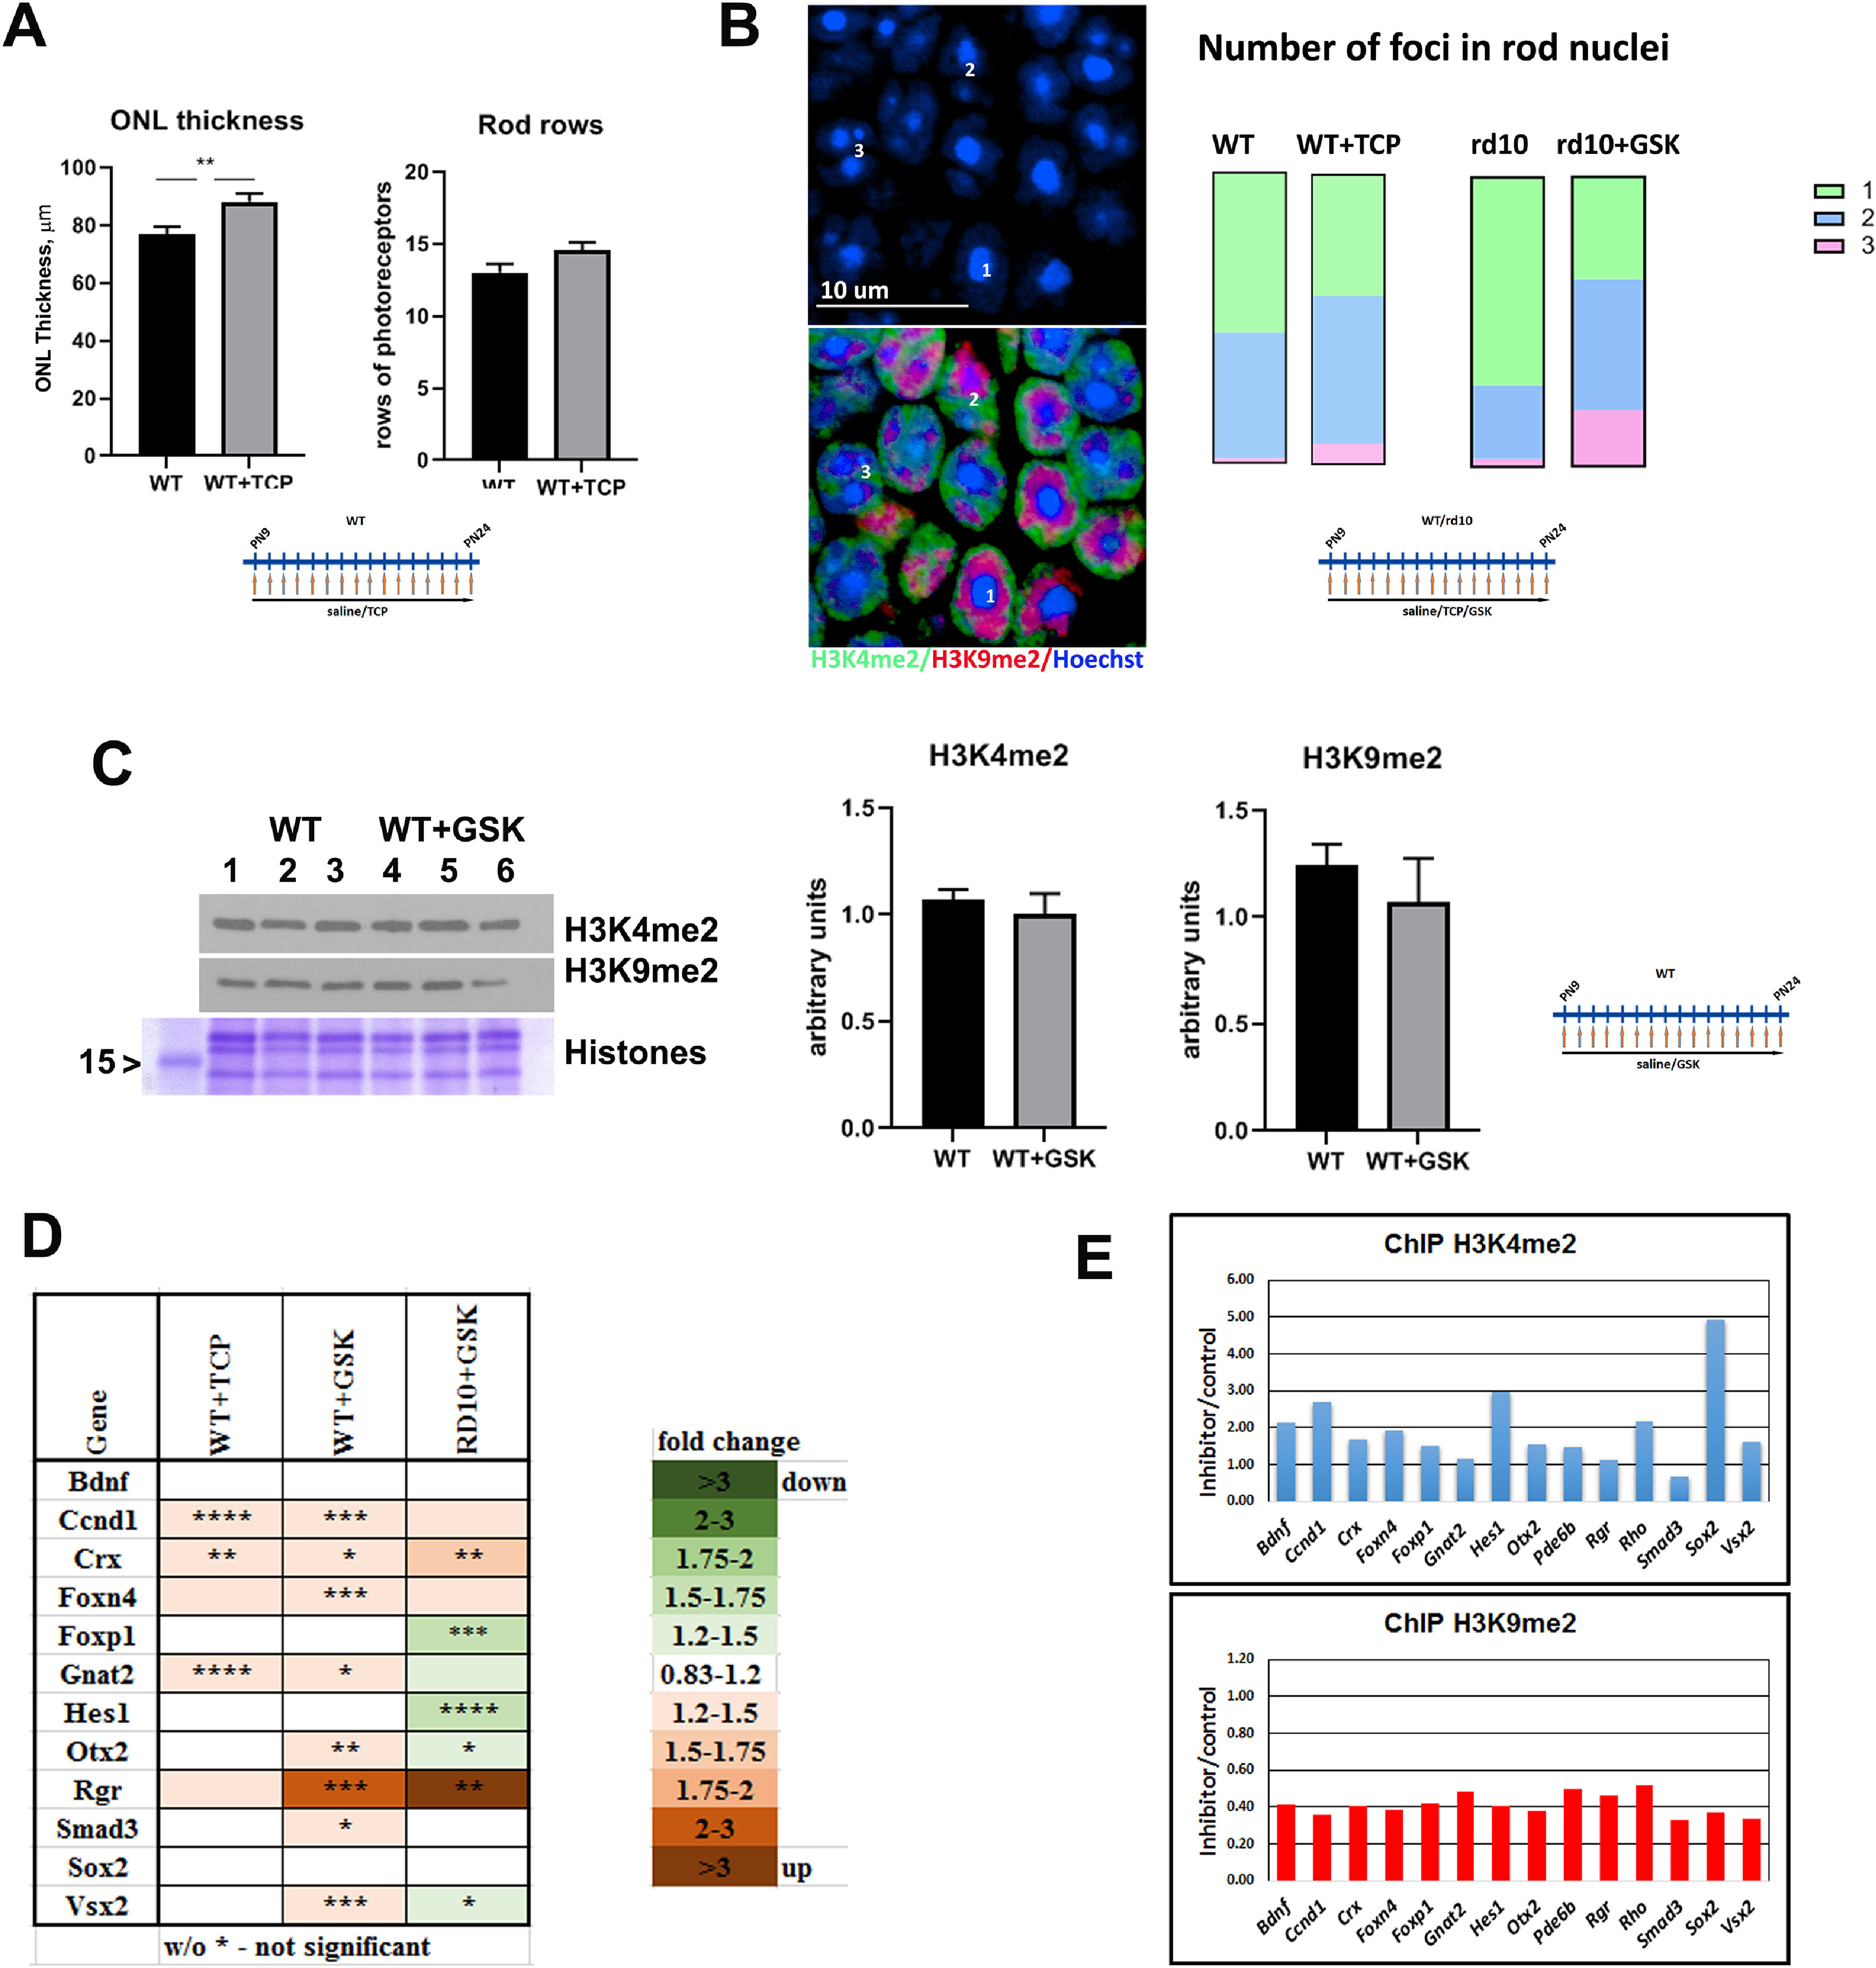
Figure 10.

LSD1 inhibition promotes epigenetic changes that create more open and accessible chromatin in rod nuclei. A, ONL thickness and rods rows were counted in central retina for P24 WT mice treated from P9 until P24 with TCP or only with saline for three to five biological and three technical replicas (±SEM). **p < 0.01. B, Comparison of the number of foci in rod nuclei in central retina at P24 for WT mice treated with saline or TCP and rd10 mice treated with saline or GSK from P9 until P24. Experiments were done for three to four biological and three technical replicas; 300–450 nuclei were counted for each sample. Left, Representative immunofluorescence microscopic image of rod photoreceptors in ONL in central mouse retina sections from P24 rd10 mice treated with GSK from P9 until P24. Bottom, Anti-H3K4me2 staining is in green (euchromatin), anti-H3K9me2 staining is in red (facultative heterochromatin), and nuclear counterstaining with Hoechst33358 is in blue (constitutive heterochromatin). Top, Image of only Hoechst33358 counterstaining demonstrates that rod photoreceptor nuclei have one, two, or three foci of heterochromatin. Right, Comparison of number of foci in rod nuclei in central retina at P24 for WT mice treated with saline or TCP and rd10 mice treated with saline or GSK from P9 until P24. Experiments were done for three to four biological and three technical replicas; 300–450 nuclei were counted for each sample. C, Left, Anti-H3K4me2 and anti-H3K9me2 Western blot with samples of retina at P24 from WT mice treated with saline or with GSK from P9 until P24. Histone Coomassie staining was used as loading control. Right, Band intensity quantification was done for three biological and three technical replicates for anti-H3K4me2 and H3K9me2 Western. Intensity of bands for histone modifications were normalized on intensity for core histone Coomassie staining. D, Heatmap of expression of progenitor/cell cycle genes measured by RT-PCR for retinas from P24 mice WT treated from P9 until P24 with inhibitors for LSD1 (TCP and GSK) relative to WT treated with saline and rd10 mice treated from P9 until P24 with GSK and compared with rd10 treated with saline. Each set of data represents three to five biological and three technical replicates (±SEM). The relative expression level for each gene was calculated by the 2-ΔΔCt method and normalized to GAPDH. *p < 0.05, **p < 0.01, ***p < 0.001, ****p < 0.0001 with fold increase in orange or decrease in green. E, Comparison of H3K4me2 and H3K9me2 accumulation on gene regulatory elements such as promoter and enhancer in mice retina at P24; WT mice were treated with saline or GSK from P9 until P24. Quantitative PCRs were done with primers (Table 2) for the area around gene regulatory elements in three technical replicas.
