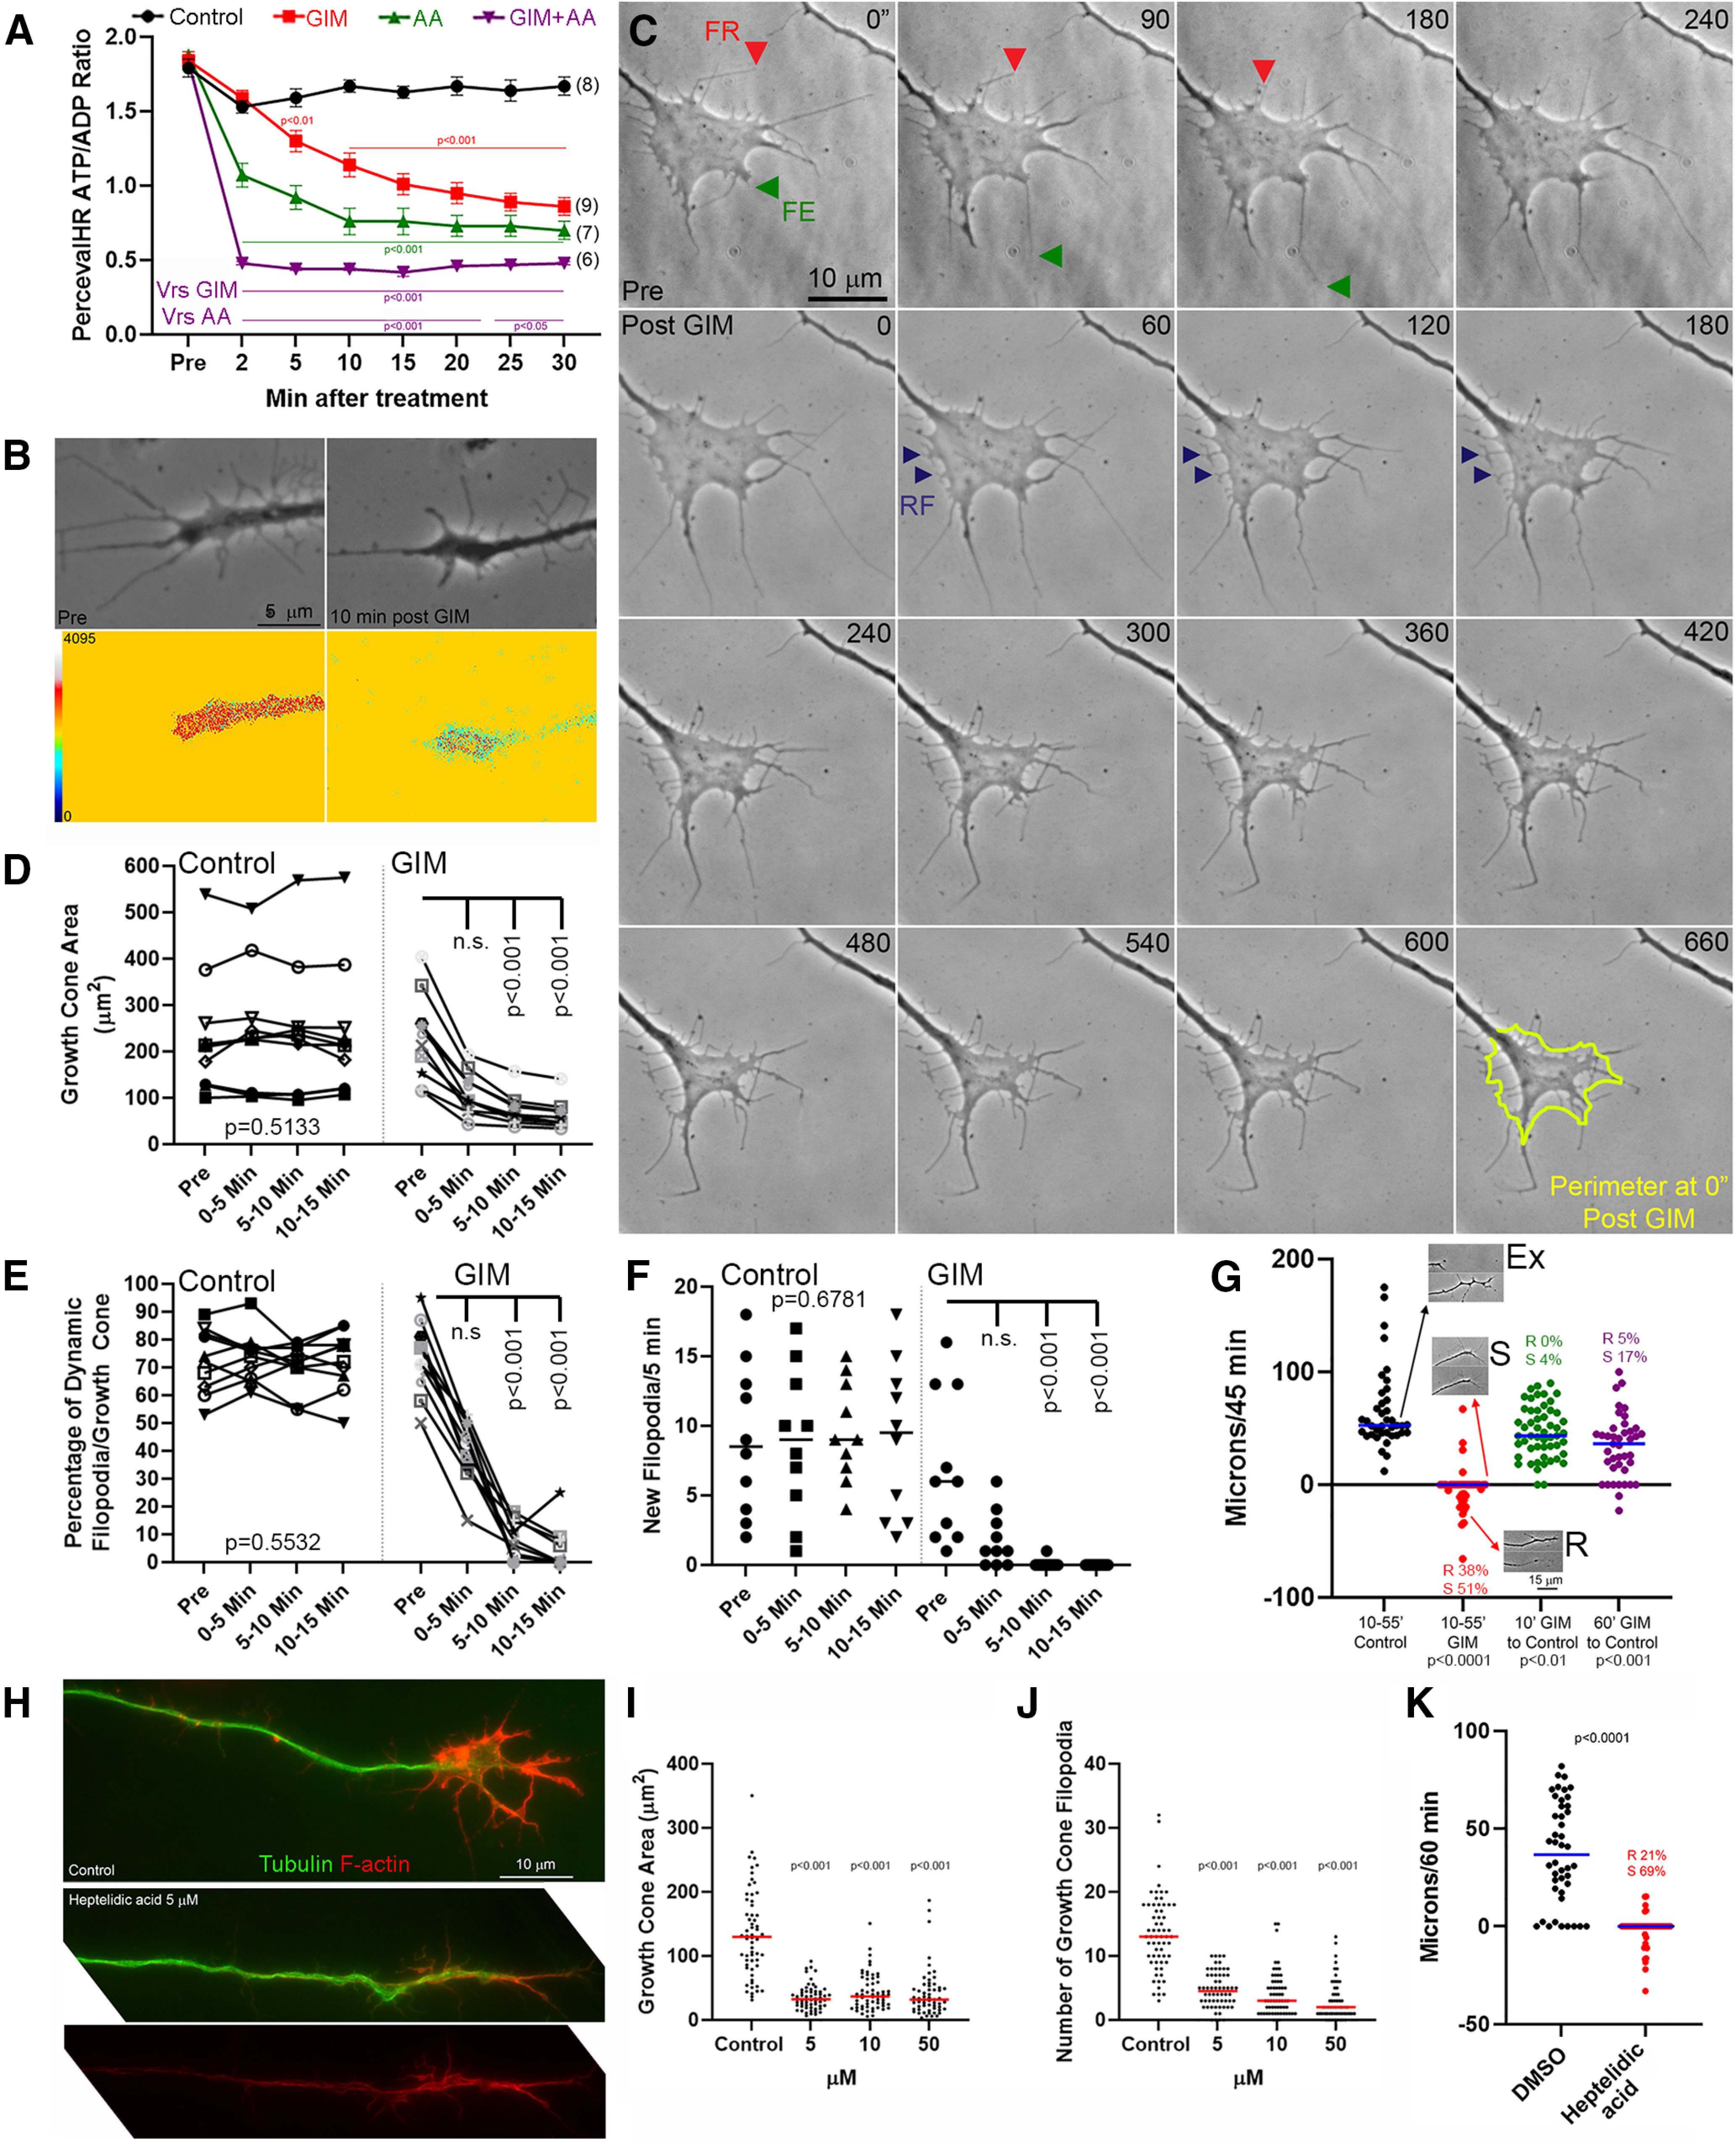
Figure 2.

Glycolysis is required for growth cone dynamics. A, Ratiometric ATP/ADP measurements in growth cones. Treatment with either GIM and AA rapidly decreases the ATP/ADP ratio (p values color-coded for GIM [red] and AA [green] relative to control treatment, and GIM+AA relative to GIM or AA [purple]). n = growth cones. Bonferroni multiple comparison tests between groups within time point. B, Examples of ATP/ADP ratio before and after GIM treatment. C, Example of the response of growth cones to GIM. In pretreatment period (top row of panels), examples of filopodial retraction (FR) and extension (FE) are shown. Post-GIM examples of retraction fibers (RF) representing no change in the position of the stabilized filopodium are denoted at 60-180 s after treatment. At 660 s, the original outline of the growth cone is shown in yellow. D-F, Repeated-measures ANOVA for control. Dunn's multiple comparison tests between each time point and Pre for GIM treatment. Each symbol represents a growth cone. D, Growth cone area as a function of GIM treatment. E, Percentage of dynamic filopodia (i.e., filopodia that exhibited extension and/or retraction of their tips). F, Number of new filopodia formed/5 min. G, Axon extension or retraction (negative values) during a 45 min period after control (black) or GIM (red) treatment. Extension/retraction during a 45 min period after an initial 10 (green) or 60 min (purple) treatment with GIM followed by return to control medium. Each symbol is one axon. Insets, Examples of extension (Ex), stalling (S), and retraction (R) and percentage of axons in R or S categories are also shown. H, Examples of the morphology and cytoskeleton of axons treated for 1 h with DMSO (control) of heptelidic acid (5 μm). I, Effects of a 1 h treatment with varying concentrations of heptelidic acid on growth cone area. Dunn's multiple comparison tests relative to control. J, Effects of a 1 h treatment with varying concentrations of heptelidic acid on the number of growth cone filopodia. Dunn's multiple comparison tests relative to control. K, Measurements of axon extension as in G following a 1 h treatment with heptelidic acid (5 μm). Mann–Whitney test. A, Mean ± SEM is shown in A and medians are shown in F and G and I-K.
