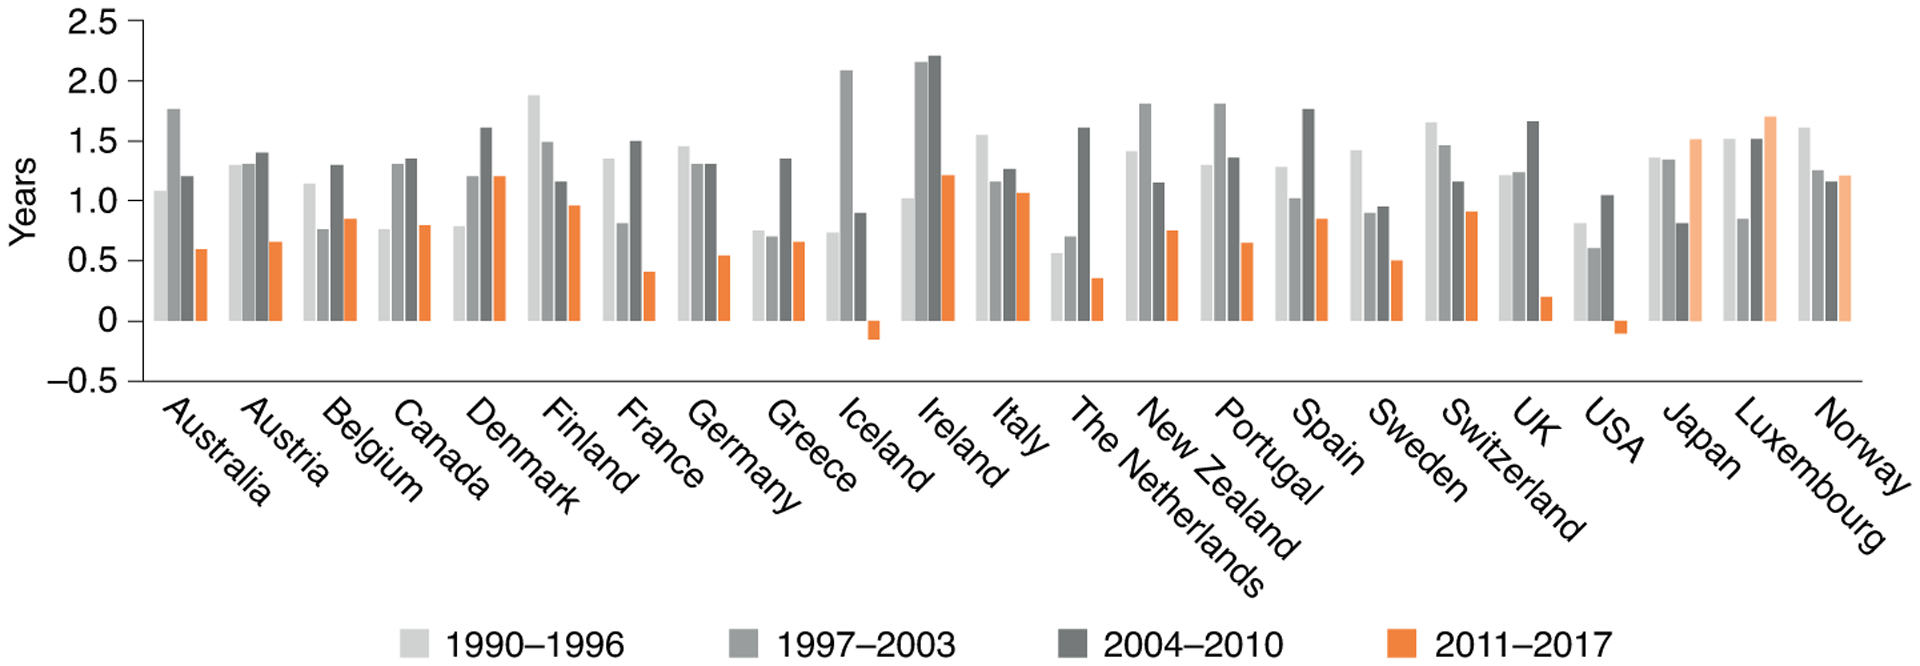
Fig. 1 |. Gains in life expectancy over four six-year periods, 1990–1996, 1997–2003, 2004–2010 and 2011–2017.

Dark orange bars indicate lower increases in life expectancy in 2011–2017 than 2004–2010, and light orange bars indicate greater recent increases in life expectancy. Relatively low gains in years of life expectancy from 2011–2017 can be seen in 20 out of 23 OECD countries compared to 2004–2010.
