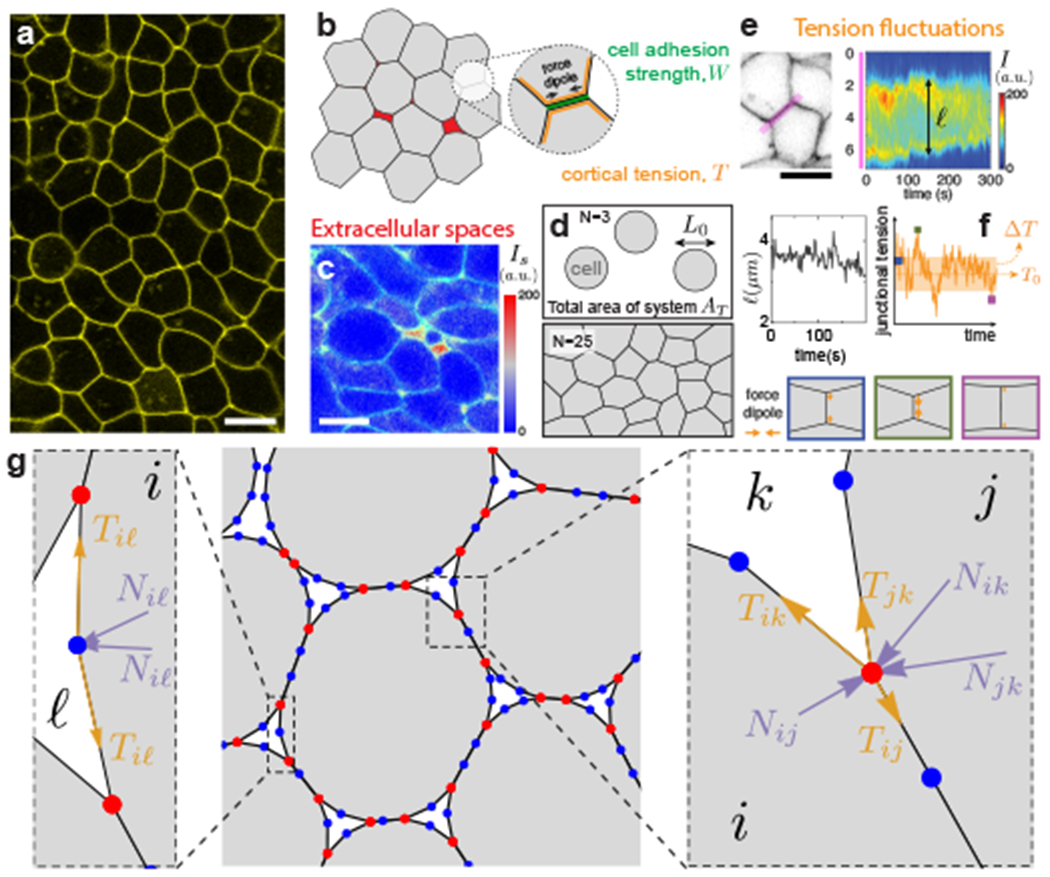
Figure 1: Characteristics of multicellular systems and simulation framework.

a, Confocal section of embryonic tissue in a zebrafish embryo (membranes labeled; yellow). b, Schematics of cortical tension and adhesion at cell-cell contacts in a multicellular system with spaces (red) between cells (gray). c, Confocal section through zebrafish embryonic tissues showing the intensity (Is) of fluorescent reporter protein secreted extracellularly as well as cell membranes (green), indicating the presence of extracellular spaces (red range). d, Schematics defining the cell size L0, cell number N and simulation box area AT, which specify cell density. e, Kymograph of membrane signal intensity (I) along a tissue region (pink; left panel) containing a cell-cell contact, showing contact length ℓ fluctuations (bottom). f, Simulated tension fluctuations causing cell-cell contact length fluctuations. Increasing (decreasing) tension shortens (lengthens) cell-cell junctions (bottom). g, Schematics of the dynamic vertex model formulation. Triple vertices (physical vertices; red) and non-physical intermediate vertices (blue) are shown.
