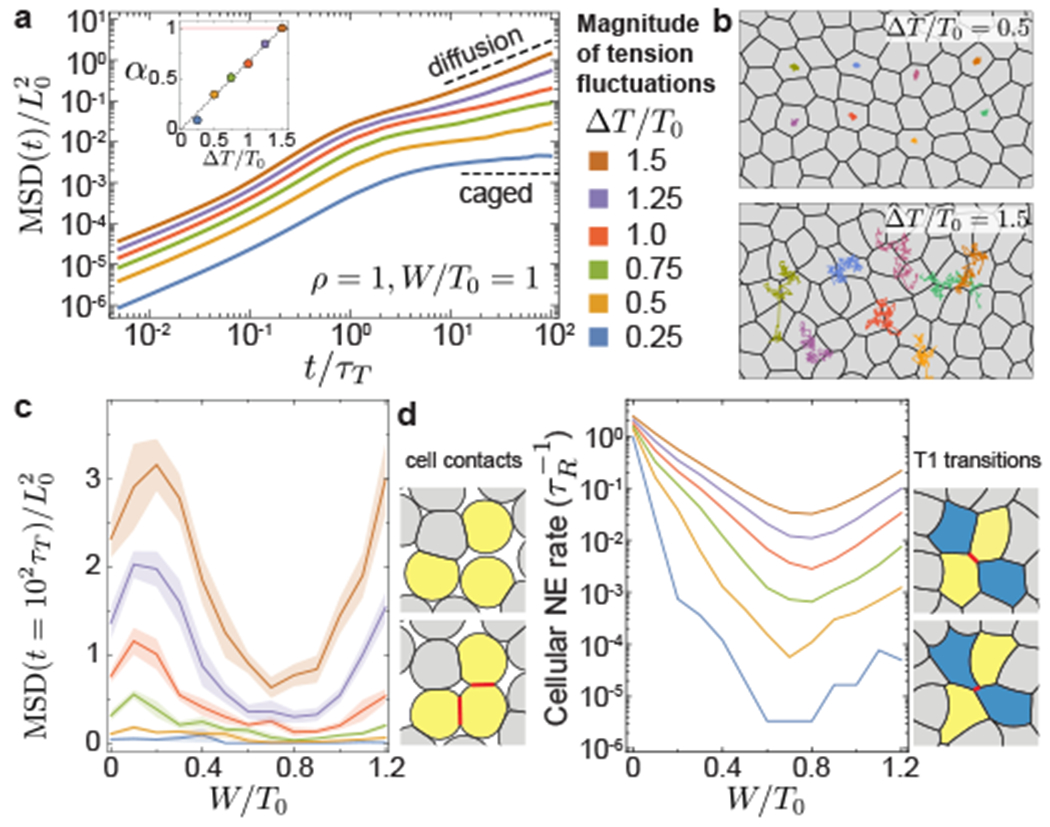
Figure 3: Tissue dynamics with finite tension fluctuations.

a, MSD for varying magnitudes of tension fluctuations ΔT/T0, showing sub-diffusive (0 < α < 1) and diffusive (α = 1) behaviors as tension fluctuation increase (inset). b, Snapshots of dynamic configurations with examples of cell trajectories over t/τT = 102. c, MSD at long timescales (t = 102τT ⪢ τT > τR), showing non-monotonous behavior for varying relative adhesion strength and minimal values at the structural transition. d, Cellular neighbor exchange (NE) rate for varying relative adhesion. Distinct types of neighbor exchange events: gain/loss of cell contacts (left) and T1 transitions (right). Error bands = SD. 10 independent simulations for each set of parameters.
