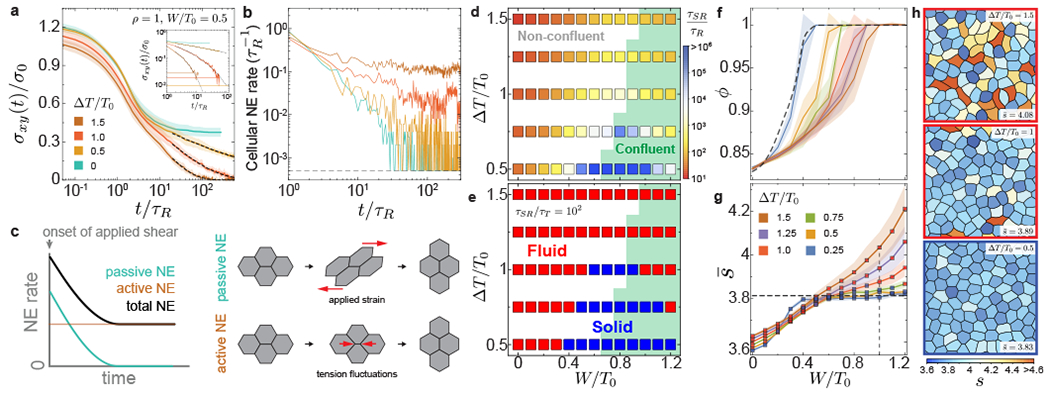
Figure 4: Stress relaxation and structure in active multicellular systems.

a-b, Stress relaxation (a) and temporal changes in cellular NE rate (b) after the imposed strain step for varying magnitudes of tension fluctuations. The long timescale stress relaxation follows stretched exponentials (black dashed lines) and eventually reaches the average value σA of active shear stress fluctuations (horizontal lines in inset). The cellular NE rate quickly decays to zero in the absence of activity (t ~ τR), but remains finite in the presence of activity. c, Sketch showing the dynamics NE induced by the externally applied shear strain (passive) and by tension fluctuations in cells (active). Active NE enables further stress relaxation and tissue fluidization after the initial passively induced NE. d, Stress relaxation timescale τSR for varying magnitude of tension fluctuations and relative adhesion, showing a sharp increase as the structural transition between non-confluent and confluent (green background) states. e, Phase diagram showing the transition between fluid and solid tissue states for different activity values and relative adhesion strength. Solid states surround the structural transition and are found both in confluent and non-confluent configurations for low enough activity. f-h, Dependence of the system volume fraction ϕ (f) and average shape factor (g; with red/blue squares indicating fluid/solid states, respectively) on relative adhesion for different magnitudes of tension fluctuations. Representative snapshots of dynamic configurations for fixed relative adhesion (W/T0 = 1; vertical dashed line in g) and increasing tension fluctuations are shown (h), with red/blue contours indicating fluid/solid states, respectively. Error bands = SD. 10 independent simulations for each set of parameters.
