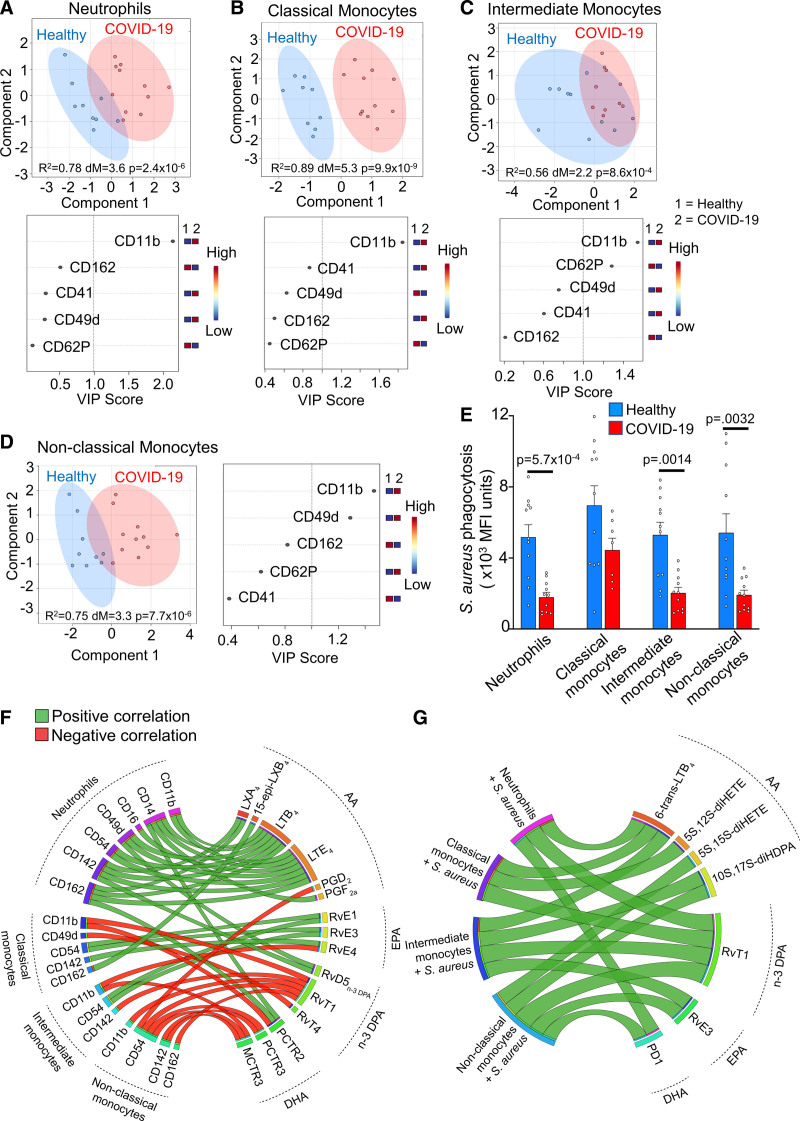
Figure 2.
Upregulation of activation markers and downregulation of S. aureus phagocytosis in circulating phagocytes from patients with coronavirus disease 2019 (COVID-19). A–D, Partial least squares discriminant analysis (PLS-DA) scores plots with 95% CI and Variable Importance in Projection (VIP) scores for activation markers on circulating phagocytes from healthy volunteers (n=9) and patients with COVID-19 (n=11) assessed by flow cytometry. E, S. aureus phagocytosis by peripheral blood neutrophils and monocyte subsets from healthy volunteers (n=11) and patients with COVID-19 (n=11) evaluated using flow cytometry. Statistical differences between healthy and COVID-19 groups were established using Mann-Whitney test for each cell type and raw P values are displayed. F–G, Circos plots of Pearson correlation coefficients between patient with COVID-19 (n=11) plasma lipid mediator (LM) levels and (F) phagocyte activation markers or (G) bacterial phagocytosis. Connecting bands represent statistically significant correlations (P<0.05), with the width of the band being proportional to the strength of the correlation (range, −0.66 to 0.83) and band color representing positive (green) or negative (red) correlations. AA indicates arachidonic acid; DHA, docosahexaenoic acid; DPA, docosapentaenoic acid; and EPA, eicosapentaenoic acid.

