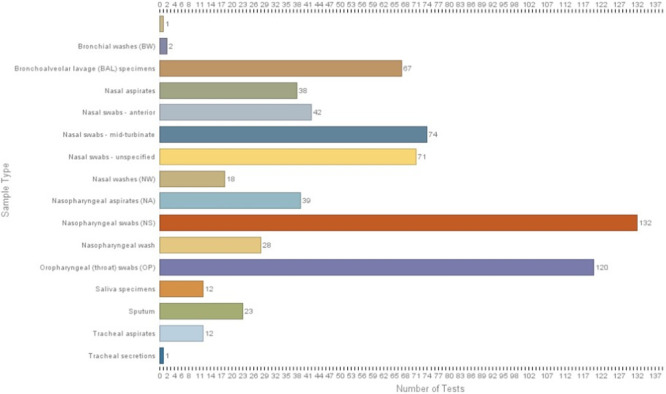
Fig 3. Example of a chart showing summary statistics for EUAdb, in this case the number of tests using a particular sample type.

In the upper right corner is a query field for showing all tests that use a selected sample type. Such charts can also be generated for RNA extraction kits, PCR master mixes, primer sets, target genes, instrumentation, and limits of detection.
