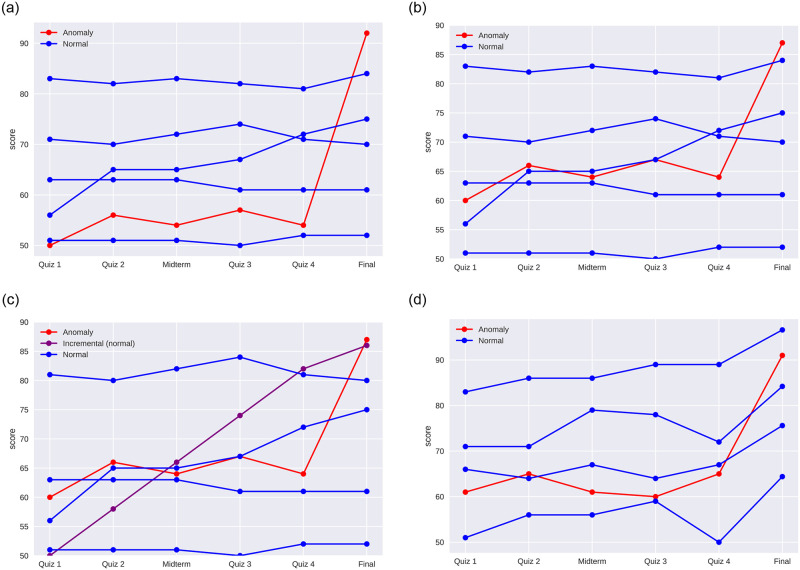
Fig 3. Representative samples of the simulated datasets used in our experiments.
The datasets capture different scenarios for the distribution of the grades. (a) A representative sample of Dataset 1 grades. The dataset consists of 91% normal and 9% anomalous grades. The normal grades consist of three quarters homogeneous grades and one quarter increasing grades. The anomalous grades rise sharply—by 35 points—during the final exam. (b) A representative sample of Dataset 2 grades. The dataset is similar to Dataset 1. However, the anomalous grades rise less sharply—by 20 points—during the final exam. As a result, the outliers are harder to identify. (c) A representative sample of Dataset 3 grades. The dataset is similar to Dataset 2. However, around 10% of the normal grades are increasing at an incremental pace so that the difference between the average prior and final exam scores are same as in the anomalous instances. As a result, it is even more challenging to identify the outlier scores. (d) A representative sample of Dataset 4 grades. The dataset is designed to simulate a scenario when the final exam is easy and everyone receives a relatively high grade. The normal final exam scores 10 points higher than the average on prior assessments. The anomalous final exam scores 25 points higher than the average preceding scores.

