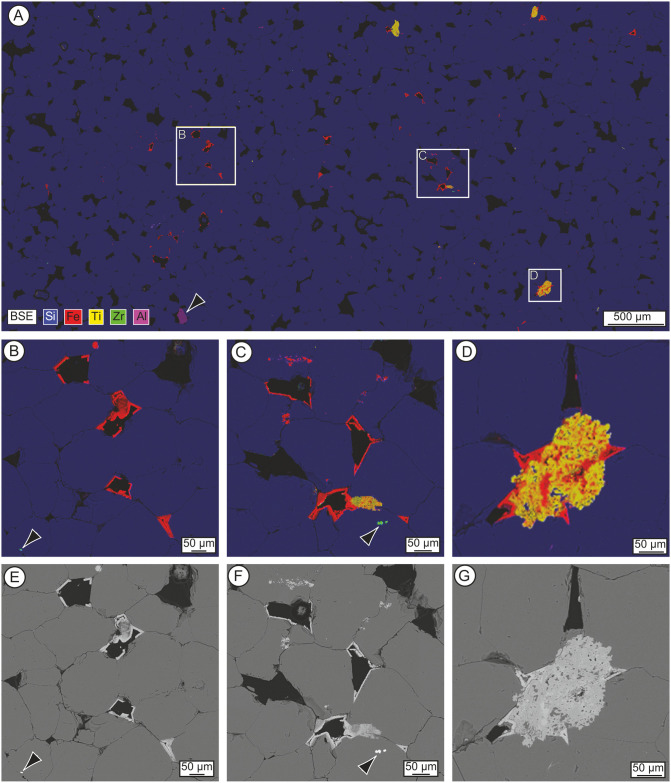
Fig 14. Energy-dispersive spectrometry (EDS) net intensity composite elemental maps (A-D) and back-scattered electron (BSE) images (E-G) of polished thin-section SH3B from the Phillips’ Core.
(A) Mosaic EDS map (3.2 μm pixel size) overlain with BSE micrograph (5100 × 2500 pixels, 1.6 μm pixel size). Quartz is represented in blue (Si), iron oxides/hydroxides in red (Fe), titanium oxides in yellow (Ti), zircon in green (Zr) and kyanite (arrow) in magenta (Al). (B-D) Image detail of the rectangles shown in (A). Arrows indicate ~5–10 μm zircon grains. (E-G) BSE images (749 nm pixel size) of the areas shown in (B-D). These images are reproduced under a CC BY 4.0 license, with permission from The Trustees of the Natural History Museum, original copyright (2019).

