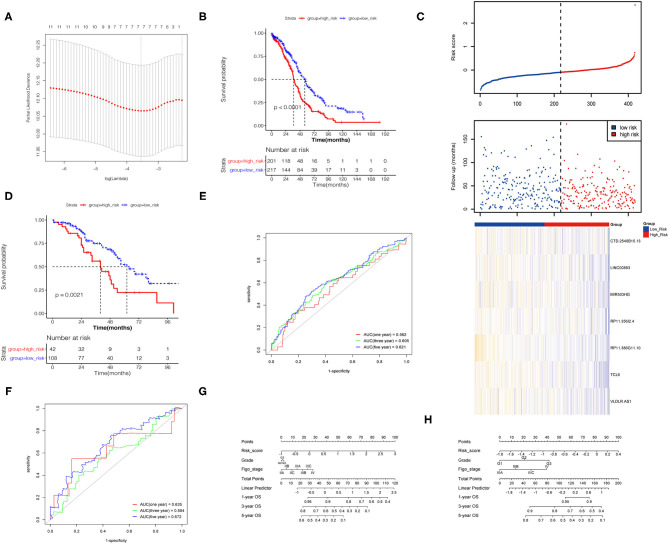
Figure 4.
Construction of the prognostic risk model. (A) The λ selection diagram in the Lasso model. (B) K–M survival curves of high- and low-risk groups for TCGA database. (C) Risk score distribution and lncRNA expression heat map for TCGA database. (D) K–M survival curves of high- and low-risk groups for GEO database. (E,F) Time-dependent receiver operating characteristic (ROC) curve for predicting OS of the risk model. (G,H) The nomogram based on the signature and clinical information.

