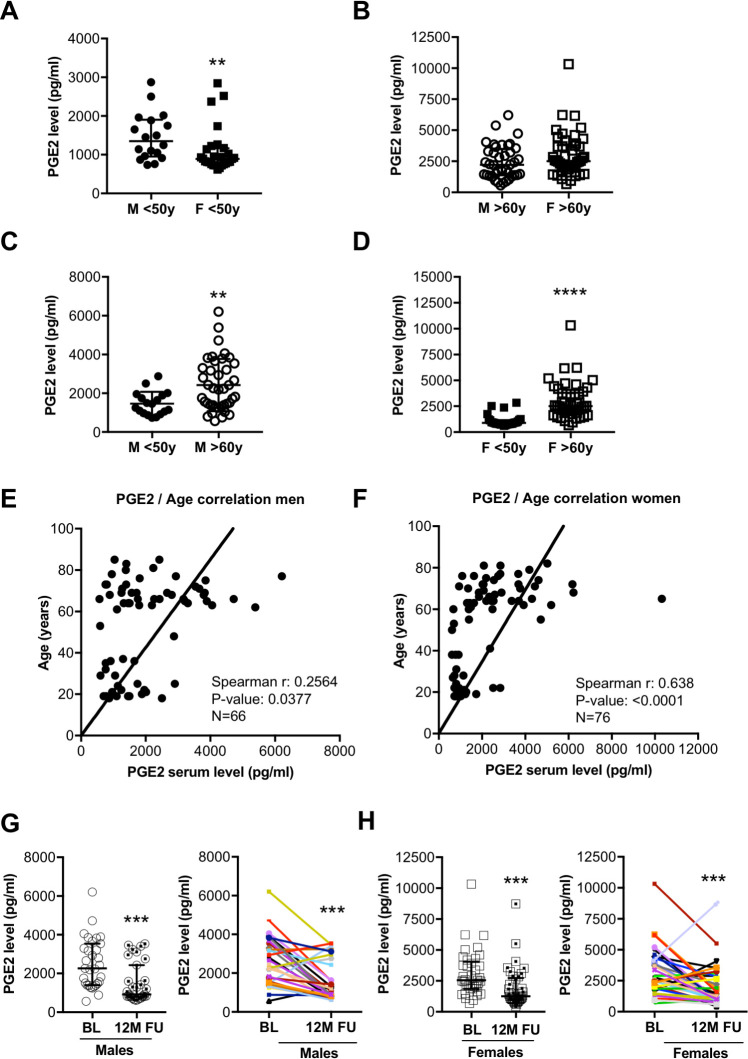
Fig 1.
(A) The dot plots summarize circulating serum PGE2 levels (pg/ml) of males (n = 18) and females (n = 28) below the age of 50 years. (B) Dot plots summarize circulating serum PGE2 levels (pg/ml) of males (n = 40) and females (n = 46) over the age of 60 years. (C) The dot plots summarize circulating serum PGE2 levels (pg/ml) of males (n = 18) <50y and males (n = 40) >60y. (D) Dot plots summarize circulating serum PGE2 levels (pg/ml) of females (n = 28) <50y and females (n = 46) >60y. Ozone correlation analysis of serum PGE2 levels with age in (E) males (n = 66, Spearman r: 0.2564, P-value: 0.0377) and (F) females (n = 76, Spearman r: 0.638, P-value: <0.0001). Circulating serum PGE2 levels at baseline (BL) and after 12-months follow-up (FU) following controlled physical training from (G) males (n = 31) and (H) females (n = 37). (A, B, D, G, H) Data are presented as median±IQR, **P<0.01, ***P<0.001, ****P<0.0001, Mann-Whitney-U test. (C) Data are presented as mean±SD, **P<0.01, unpaired two-tailed t-test. (E, F) Ozone correlation, Spearman correlation coefficients, two-tailed P value. Underlying data can be found in S1 Data.

