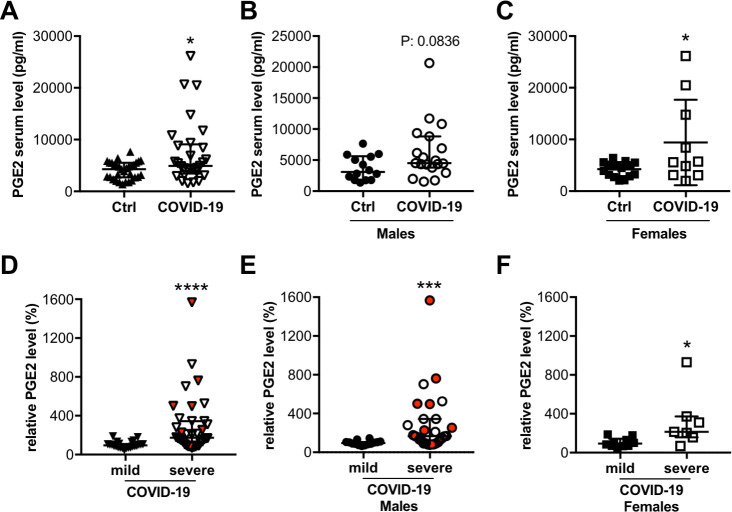
Fig 2. Circulating PGE2 levels are elevated in COVID-19 patients.
The dot plots summarize circulating serum PGE2 levels (pg/ml) of (A) COVID-19 patients (n = 29) and healthy controls (n = 31), and separately (B) for males (COVID-19 male patients n = 19; healthy male controls n = 14) and (C) for females (COVID-19 female patients n = 10; healthy female controls n = 17). The dot plots summarize relative circulating plasma PGE2 levels (in %) (D) of patients with severe (n = 36) and mild (n = 24) disease, and separately (E) for males (severe affected males n = 29; mild affected males n = 14) and (F) for females (severe affected females n = 7; mild affected females n = 10); the median of patients with mild disease was set at 100%. Dots representing patients who died with COVID-19 disease are highlighted in red. (A, B, D-F) Data are presented as median±IQR, *P<0.05, ***P<0.001, ****P<0.0001, Mann-Whitney-U test. (C) Data are presented as mean±SD, *P<0.05, unpaired two-tailed t-test. Underlying data can be found in S1 Data.

