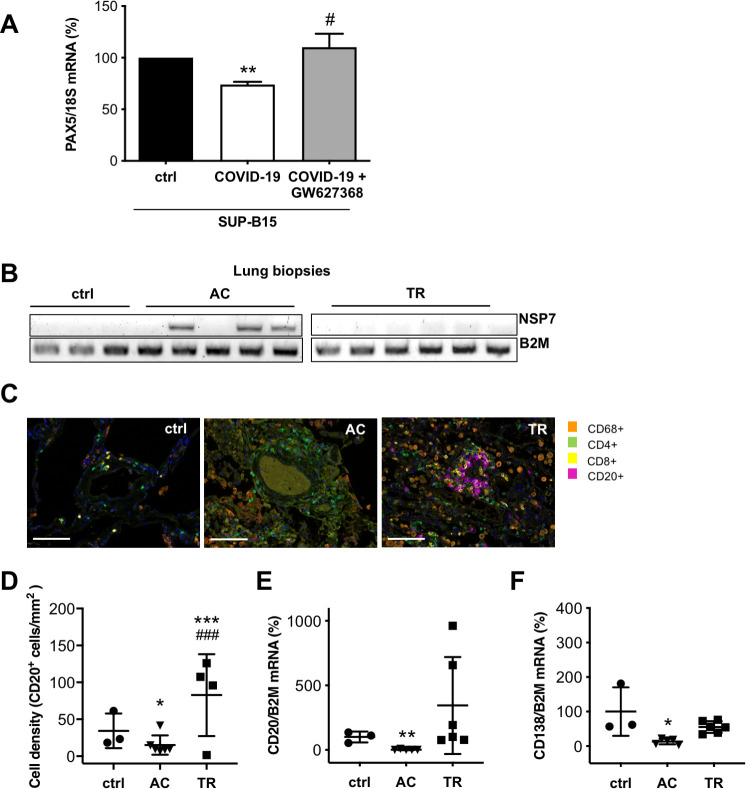
Fig 5. Modulation of the immune response in COVID-19 patients.
(A) The bar graph summarizes PAX5 mRNA expression of SUP-B15 pre-B-cells treated with serum from healthy controls (serum pooled from 9 controls) and from COVID-19 patients (serum pooled from 9 COVID-19 patients) incubated with and without GW627368 (10 μM). Control cells were treated with the solvent DMSO (n = 6 wells with control serum and n = 3 wells with serum of COVID-19 patients with and without GW627368). (B) Representative gel image of NSP7 and B2M mRNA expression in control lung tissue (ctrl), in lung tissue of patients with severe acute COVID-19 disease (AC) and in lung tissue obtained after transplant rejection (TR). (C) Immunohistochemical staining for CD68+, CD4+, CD8+ and CD20+ immune cells (scale bar: 100 μm), (D) Dot plot summarizing the immunohistological quantification of CD20 positive B-cells per area (mm), dot plots summarize mRNA expression of (E) CD20 and (F) of CD138 in control lung tissue (ctrl), in the lung tissue of patients with severe acute COVID-19 disease (AC) and in lung tissue obtained after transplant rejection (TR). (A) One sample t-test, **P<0.01 vs. ctrl, # P<0.05 vs. serum from COVID-19 patients. (D) Statistical analysis was performed using the generalized linear model with Gaussian distribution and weights adjusted according to the number of ROIs per patient, ***P<0.001 vs. ctrl, ###P<0.001 vs AC. (E, F) unpaired two-tailed t-test, **P<0.01 vs. ctrl, *P<0.05 vs. ctrl. Underlying data can be found in S1 Data and uncropped gel images in S7 Fig.

