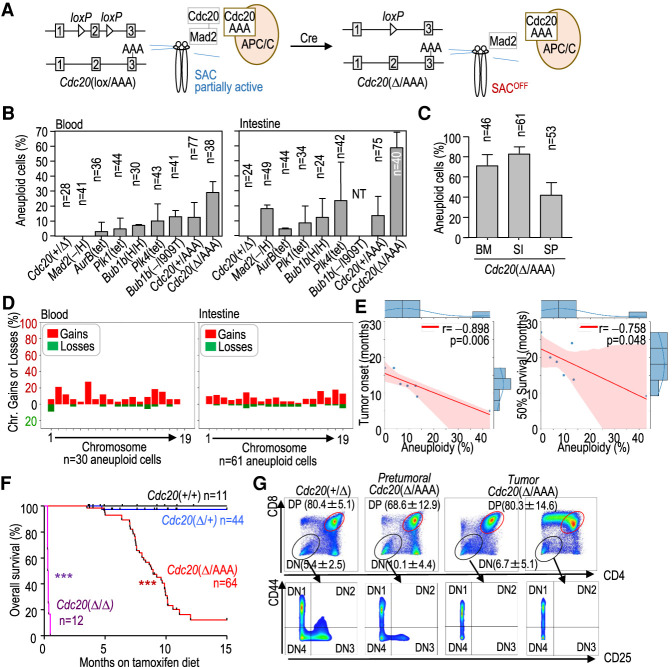
Figure 1.
A novel model with high levels of CIN in adult mouse tissues. (A) Schematic representation of the spindle assembly checkpoint (SAC) and the effect of the new Cdc20Δ/AAA mouse model on checkpoint function, allowing entry into anaphase in the presence of unattached kinetochores. (B) Percentage of blood or intestine aneuploid cells in 3-mo-old mice with the indicated genotypes. (NT) Not tested. (C) Percentage of aneuploid cells in bone marrow (BM), small intestine (SI), and spleen (SP) from three Cdc20Δ/AAA mice 5–9 mo after CRE activation. In B and C, data are mean ± SEM. Data correspond to two mice per genotype (3 mo old; B) or three mice per tissue (5–9 mo old; C). The number of cells analyzed by single-cell DNA sequencing is indicated in every column. (D) Percentage of specific chromosomal gains (red) or losses (green) in the aneuploid (N = 33 blood and 62 intestine) cells from all models represented in B. (E) Correlation between total aneuploidy (taking all blood and intestine cells) and age (in months) at which tumors appear (tumor onset) or at which 50% of the colony is alive in the models indicated in B. Data are taken from Supplemental Table S1. (r) Pearson's correlation coefficient, (p) P-value. Red shading represents the 95% confidence interval. (F) Kaplan-Meier survival curves of mice with the indicated genotypes after treatment with tamoxifen. (***) P < 0.001 (log rank Mantel-Cox test). (G) Representative flow cytometry analysis of the indicated cell populations in thymuses from Cdc20+/Δ and Cdc20Δ/AAA mice or thymic lymphomas in Cdc20Δ/AAA mice. Numeric data indicate mean ± SD (n = 3 mice per group).

