Figure 2.
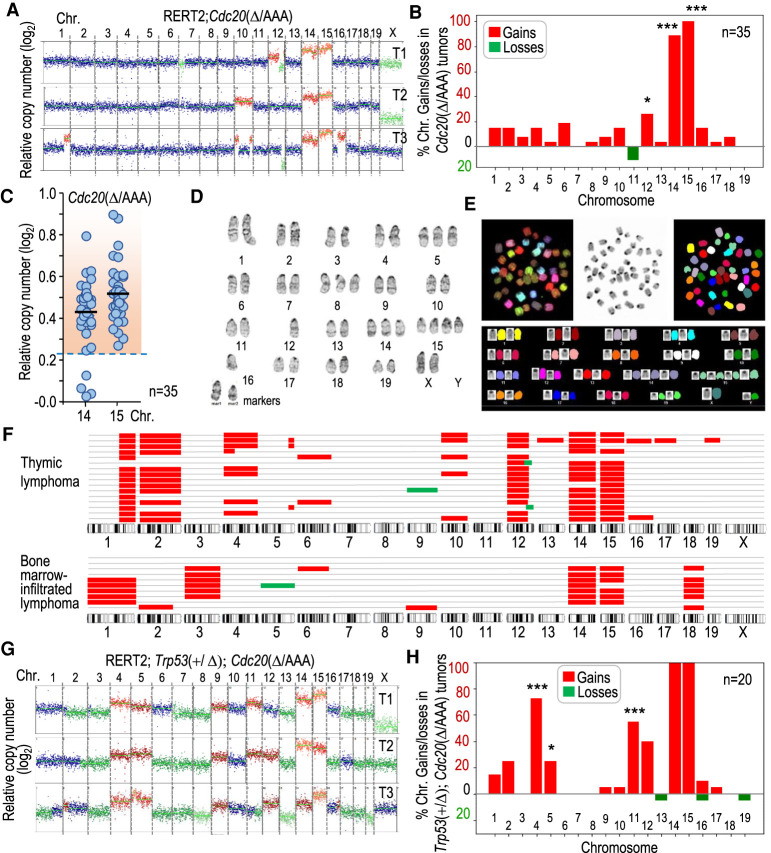
Karyotype distribution in Cdc20Δ/AAA T-cell lymphomas. (A) Representative segmentation plots of three different T-cell lymphomas from Cdc20Δ/AAA mice, depicting relative copy number per chromosome to a euploid reference on a log2 scale as scored by bulk DNA sequencing. Chromosomal gains are in red and losses in green. (B) Quantification of the percentage of Cdc20Δ/AAA tumors in which each of the individual chromosome gain or loss is present (n = 35 tumors). A chromosome was considered gained when log2 relative copy number > 0.23 and lost when this value is <−0.32 (see the Materials and Methods). Statistics refer to the comparison with lack of gains and losses in 18 Cdc20+/Δ thymic cells analyzed. (C) Relative copy number (log2) of chromosomes 14 and 15 in Cdc20Δ/AAA lymphomas. Each dot indicates an individual tumor. The dashed region indicates samples in which the copy number is above the threshold selected to define chromosomal gains (mean value + 3 SD in euploid cells). (D) Giemsa staining of a representative metaphase spread from a Cdc20Δ/AAA lymphoma. (E) Spectral karyotype of a representative metaphase spread from a Cdc20Δ/AAA lymphoma. (F) Schematic representation of chromosomal gains (red) and losses (green) as detected by single-cell DNA sequencing (scDNA-seq) in primary tumors or bone marrow infiltrations from a tumor. Each row represents a single cell. (G) Representative examples of chromosomal gains (red) or losses (green) in three different T-cell lymphomas from Trp53+/Δ; Cdc20Δ/AAA mice as scored by bulk DNA sequencing. (H) Quantification of the percentage of Trp53+/Δ; Cdc20Δ/AAA tumors with the indicated specific chromosome gains or losses (n = 20 tumors). Statistics refer to the comparison with gains and losses in Cdc20Δ/AAA lymphomas in B. In B and H, (*) P < 0.05, (***) P < 0.001 (Fisher exact test); nonsignificant (P > 0.05) differences not shown.

