Figure 6.
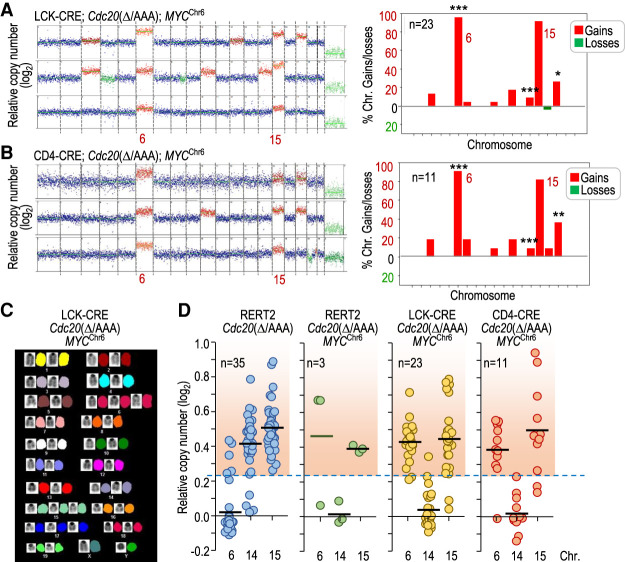
MYC drives specific chromosome gains in Cdc20Δ/AAA tumors. (A) Representative karyotype of three tumors from LCK-CRE; Cdc20Δ/AAA; MYCChr6 mice as determined by DNA sequencing. The plot to the right shows the distribution of chromosomal gains and losses in these animals (n = 23). (B) Representative karyotype of three tumors from CD4-CRE; Cdc20Δ/AAA; MYCChr6 mice as determined by DNA sequencing. The plot to the right shows the distribution of chromosomal gains and losses in these animals (n = 11). In A and B, statistics refer to the comparison versus gains and losses in Cdc20Δ/AAA thymic lymphomas (Fig. 2B). (*) P < 0.05, (**) P < 0.01, (***) P < 0.001 (Fisher exact test); nonsignificant (P > 0.05) differences not shown. (C) Representative SKY analysis of a T-cell lymphoma in LCK-CRE; Cdc20Δ/AAA; MYCChr6 mice showing specific gains of chromosomes 6 and 15, among others. (D) Relative copy number of chromosomes 6, 14, and 15 in T-cell lymphomas from mice with the indicated genotypes. The red-shaded region indicates copy number values higher than the threshold selected for chromosome gains (the mean + 3 SD of the euploid value). Data for chromosomes 14 and 15 in RERT2; Cdc20Δ/AAA are taken from Figure 2C for comparison. Each dot indicates an individual tumor.

