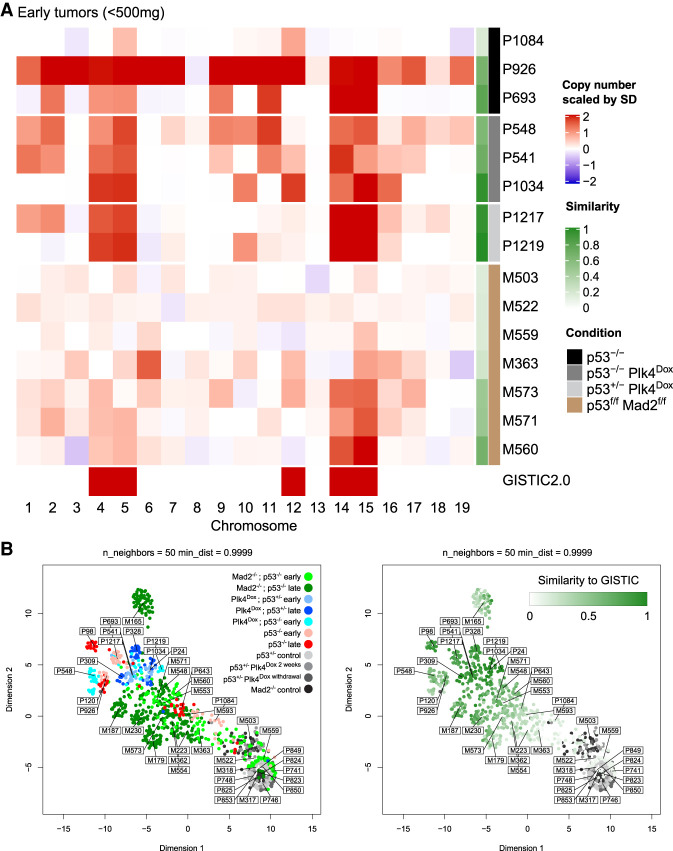
Figure 5.
Transient CIN selects for a specific aneuploidy profile early during tumor development. (A) Heat map showing averaged DNA copy number changes in early tumors (<500 mg) from noninduced p53−/− PRG5 mice (black), 2-wk doxycycline-treated (at the age of 30 d) p53−/− PRG5 mice (dark gray) and p53+/− PRG5 mice (light gray), and Lck-Cre+; Mad2f/f; p53f/f mice (brown) as determined using single-cell whole-genome sequencing. Single-cell data of tumors from PRG5 mice are in Supplemental Figure S12, and of Mad2 mice in Supplemental Figure S10. Genomic identification of significant targets in cancer (GISTIC) 2.0 analysis showing significant aneuploidies across all tumors is shown at the bottom. The similarity of individual tumors to the GISTIC 2.0 output is presented in the green heat map. (B, left) Uniform manifold approximation and projection (UMAP) analysis of DNA copy number changes in control (gray shades), p53−/− noninduced PRG5 tumors (red shades), doxycycline-induced PRG5 tumors (blue shades), and Mad2 tumors (green shades). (Right) Embedding of the GISTIC 2.0 similarity score for each sample shown in the UMAP plot at the left. Control samples were not used for the GISTIC 2.0 analysis and appear in gray shades.

