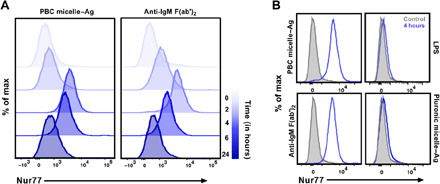
Fig. 1. Up-regulation of Nur77 by PBC micelle–Ag complexes.

(A) Representative histograms for Nur77 antibody expression in B cells. Total splenic cells following RBC lysis from C57BL/6 mice stimulated with either PBC micelle–Ag or Pluronic F127 micelle–Ag (at 10 μg/ml each component) are shown. LPS (0.5 μg/ml) and anti-IgM Fa(ab′)2 (10 μg/ml) were used as controls. Cells were stained for cell surface marker (CD19) for B cell gating and intracellularly stained for Nur77 antibody at 2, 4, 6, or 24 hours after stimulation. Cells analyzed at 0 hour after stimulation were shown to indicate background levels of Nur77 expression. (B) Representative histograms for Nur77 induction following 4 hours (peak) of stimulation for four treatment groups (blue lines) and unstimulated control (light gray, filled). Data are representative of three independent experiments.
