
Fig. 4. Ag presentation to B cells by PBC micelles in Tg mice.
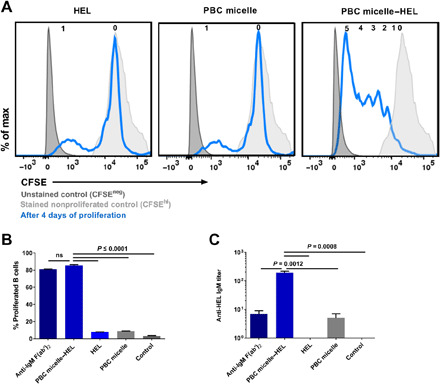
(A) Representative histograms for CFSE-stained (blue lines) viable B cells (Zombie−CD3−CD19+B220+) 4 days after stimulation of splenic cells from C57BL/6-Tg(IghelMD4)4Ccg/J mice with various treatment groups [anti-IgM F(ab′)2, HEL, and PBC micelles at 10 μg/ml]. Anti-CD40 (5 μg/ml) was added to all the treatment groups except unstimulated controls. The number of daughter populations is indicated in a row on top of each histogram. Peaks for CFSE-unstained cells (dark gray, filled) and CFSE-stained nonproliferated cells (light gray, filled) are also shown. (B) Percent proliferated viable B cells as determined by CFSElo gating. (C) Anti-HEL IgM in the supernatants of cells stimulated with different treatment groups for 10 days. For cell culture, splenic cells (0.5 × 10⁶ cells per well) were stimulated in 96-well U-bottom plates. Data are represented as mean ± SEM. Data were analyzed using one-way ANOVA followed by Tukey’s post hoc test; n = 4 animals per group. In addition to the significance denoted in the image with the respective P values, mean values for PBC micelle and HEL are not significant from medium-only control in (B) and (C).