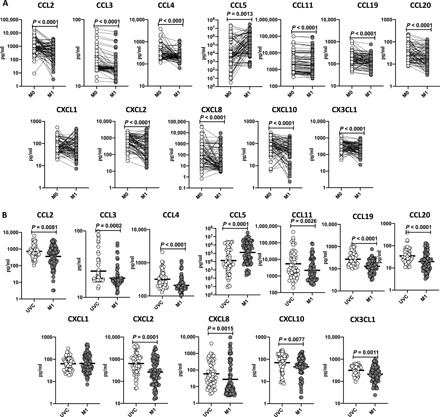
Fig. 2. BCG vaccination results in diminished plasma levels of chemokines.

(A) The plasma levels of CC chemokines in BCG prevaccinated (M0) (n = 64) and M1 after vaccination (n = 82) and plasma levels of CC chemokines in BCG-unvaccinated (UVC) (n = 55) and postvaccinated (M1) (n = 82) individuals are shown. (B) The plasma levels of CXC chemokines in BCG prevaccinated (M0) (n = 82) and M1 after vaccination (n = 82) and plasma levels of CXC chemokines in BCG-unvaccinated (UVC) (n = 55) and postvaccinated (M1) (n = 82) individuals are shown. The data are represented as scatter plots with each circle representing a single individual. For the analysis of M0 and M1, P values were calculated using the Wilcoxon matched-pair tests with Holms correction for multiple comparisons; for the analysis between UVC and M1, P values were calculated using the Mann-Whitney test with Holm’s correction for multiple comparisons.
