
Fig. 1. The geographical distribution and genome-wide phylogeny of Heliconius butterflies.
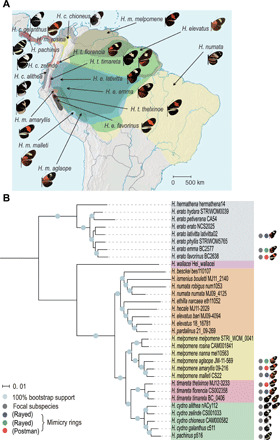
(A) The distributions of sampled subspecies/species are shown in different colors, along with wing pattern images. (B) The maximum likelihood phylogenetic tree was constructed on the basis of 102.5 Mb of genome-wide SNP data. The color ranges represent major clades. The scale bar represents the percentage of substitutions per site. The round labels indicate the selected subspecies used in downstream analyses, among which the three H. melpomene subspecies form co-mimicry pairs with selected H. erato subspecies and H. timareta subspecies.