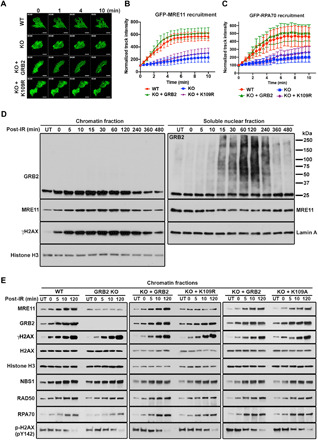
Fig. 4. GRB2 recruits MRE11 to the DNA damage sites.

(A) GFP-MRE11 was transfected into the indicated stable cells, followed by UV-LMI imaging. Scale bars, 10 μm. (B) GFP-MRE11 track intensity values from 20 cells at every 30 s were quantified with ImageJ, and normalized average intensities are shown with the SD. (C) Kinetics of GFP-RPA70 recruitment to micro-irradiated regions in HeLa cells. GFP-RPA70 was transfected into the indicated stable cells, followed by UV-LMI imaging. Track intensities were calculated as described in (B). (D) HeLa cells exposed to 5-Gy IR (152 s) were either immediately lysed (0 min) or allowed to recover for the indicated time. The chromatin fractions and the soluble nuclear fractions were analyzed with indicated antibodies. (E) Cells were either untreated (UT) or irradiated with 5-Gy IR (152 s) and then lysed immediately (0 min) or allowed to recover for the indicated time. Chromatin fractions were analyzed by Western blot with the indicated antibodies (left). Comparison of GRB2-KO HeLa cells reconstituted with either WT (KO + GRB2) or K109R (KO + K109R) mutant (middle). Comparison of GRB2-KO HeLa cells reconstituted with either WT (KO + GRB2) or K109A (KO + K109A) mutant (right).
