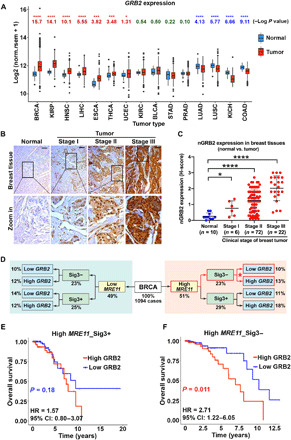
Fig. 8. GRB2 expression affects survival upon high expression of MRE11 in an HDR-proficient cohort.

(A) GRB2 expression in TCGA tumors and matched normal tissues. Log P values were from Wilcoxon tests, with greater values indicating stronger differences; GRB2 expression was higher in tumors than in matched controls in BRCA, KIRP, HNSC, LIHC, ESCA, THCA, and UCEC (red) but lower in tumor than in controls in LUAD, LUSC, KICH, and COAD (blue). Datasets with >10 normal samples were included. Box plots display the interquartile range (IQR) from Q1 to Q3 (25 to 75% percentiles), median (center line), whiskers extending to the minimum (Q1 − 1.5*IQR) and maximum (Q3 + 1.5*IQR), and outliers (dots). (B) GRB2 expression in breast tumor tissue array. Scale bars, 50 μm. (C) H-score quantification of nGRB2 IHC staining for 100 BRCA and 10 normal tissue samples. The significance was analyzed by two-sided Student’s t test. *P ≤ 0.05 and ****P ≤ 0.0001. (D) Schematic diagram of BRCA patient stratification according to MRE11 expression and signature 3. (E and F) Kaplan-Meier survival curves and hazard ratios (HR) for TCGA breast cancer patients with high (above mean) MRE11 expression scored positive [n = 285; Sig3+ (E)] or negative [n = 226; Sig3− (F)] for signature 3 mutations and low (at or below mean) or high (above mean) GRB2 expression; P values from log-rank tests. CI, confidence interval.
