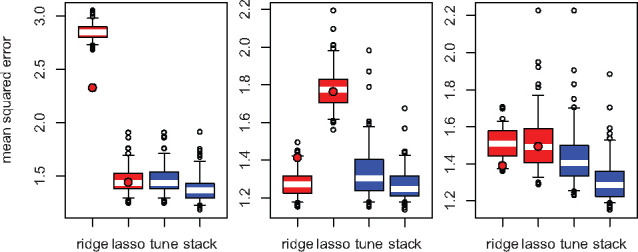
Fig. 2.

Out-of-sample mean squared error in the first (left), second (centre) and third (right) scenarios. The filled circles indicate the medians from the ridge-like () and lasso-like () elastic net. (The boxes show the interquartile ranges, and the whiskers show the ranges from the to the percentiles)
