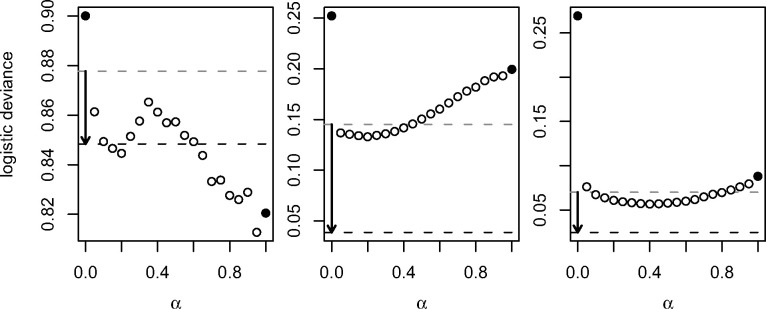
Fig. 4.
Median cross-validated logistic deviance against the elastic net mixing parameter, for ‘colon’ (left), ‘leukaemia’ (centre), and ‘SRBCT’ (right). The filled circles indicate ridge () and lasso () regularization. The dashed lines indicate tuning (grey) and stacking (black). (For ‘SRBCT’, we show the mean over the medians from the four binary problems)

