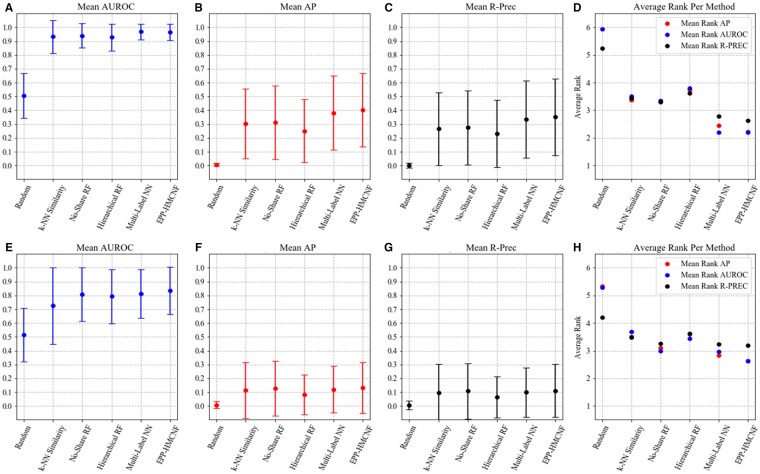
Fig. 4.
Evaluation of promiscuity prediction models trained without including inhibitor information under random split (top row), and under realistic split (bottom row), and evaluated using the Full Test Set. (A, E) Mean AUROC, (B, F) Mean AP, (C, G) Mean R-PREC and (D, H) Average rank per method. Intervals shown in (A, B, C, E, F, G) represent ±1 standard deviation

