Figure 4.
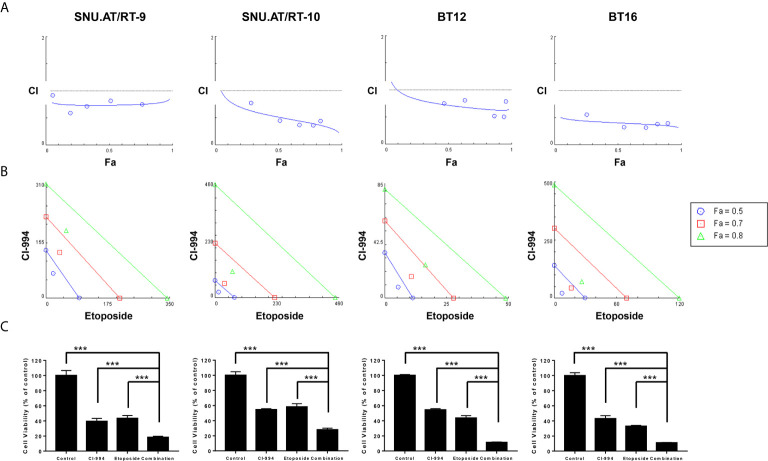
Synergistic effect of the combination treatment of CI-994 with etoposide in atypical teratoid/rhabdoid tumor (AT/RT) cells. Fraction affected vs. combination index (Fa-CI) plot was calculated for the combination of CI-994 with etoposide using an isobologram. (A) Dose-response curve shows that if the combination points (blue lines) lie below the gray line, there is a synergistic effect. Low CI values with increased Fa values suggest better compatibility and high synergism between CI-994 and etoposide. Graphs show a synergistic effect in all AT/RT cells. (B) The blue, red and green lines represent the theoretical additive line and the 0.5, 0.7 and 0.8 values, respectively. The synergy between CI-994 and etoposide increases as the calculated values approach the origin. In all AT/RT cells, synergism was observed at concentrations with Fa 0.5, Fa 0.7 and Fa 0.8 points. (C) Combination treatment of CI-994 with etoposide was significantly more effective than single treatment in all AT/RT cells. ***p < 0.0001.

