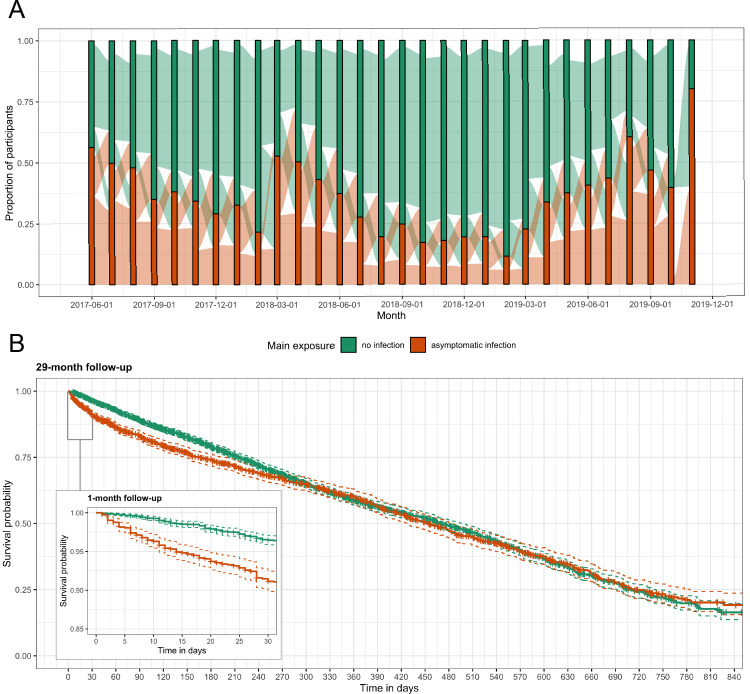
Figure 2. Asymptomatic malaria exposure classifications and symptomatic malaria outcomes over time.
(A) The proportion of participants who had either an asymptomatic infection (orange) or were uninfected (green) at each monthly visit is indicated by the bars. The ribbons connecting the bars illustrate the proportion of participants who moved exposure status from month to month. Orange ribbons indicate the proportion of participants with asymptomatic infections and green the proportion that were uninfected. (B) A Kaplan-Meier survival curve of symptomatic events across the follow-up period stratified by asymptomatic malaria exposure is displayed. Each exposure-outcome pair depicted in Figure 1 is plotted, and therefore each study participant is registered in the curve multiple times, equal to the number of exposure classifications.

