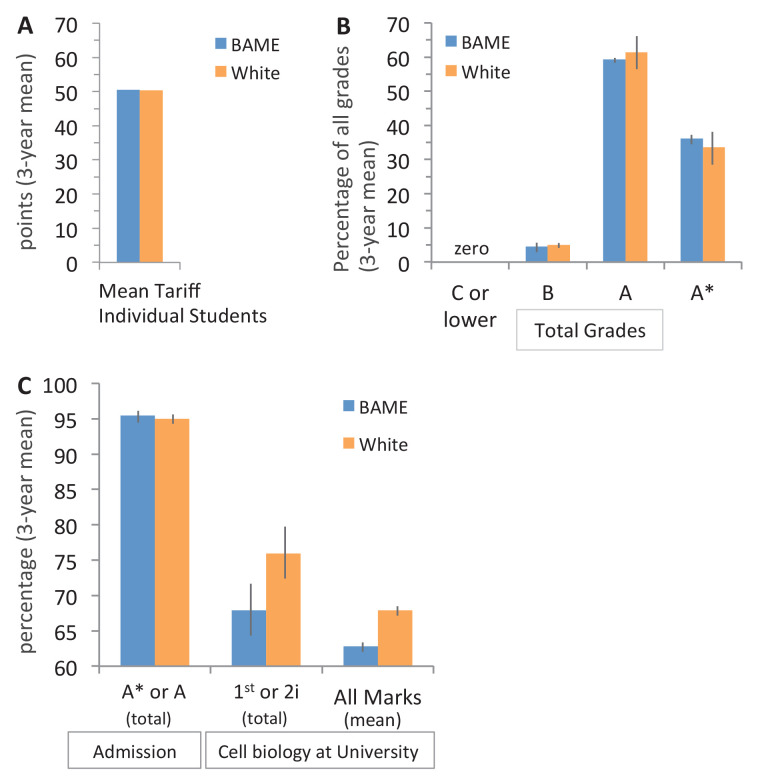
Figure 1. Entrance qualifications are near identical for BAME and white students in this study.
(A) Top three A-level grades awarded to the first three cohorts in year 1–2 pathway that entered UCL between 2013–2015: grades were converted to the UK standard points tariff (see Entrance qualifications for cell biology students in this study), the average for each student was calculated, and the mean of all three cohorts was determined (SEM: ±0.15 for BAME and ±0.33 for white students, which are too small to see on the graph). N = 179 students (82 BAME, 97 white); 536 entrance grades (246 BAME, 290 white). (B) Percentage of grades awarded to students in (A) that were C or lower, B, A, or A*: 3 year mean (± SEM). (C) The percentage of top admission (A* and A) grades awarded to BAME and white students in (A), the percentage of students that received the top two grade bands (first or 2i) in year 2 of cell biology in 2014–2016 (same students shown in (A)), and their average mark in year 2 of cell biology: each column: (3 year mean ± SEM).

