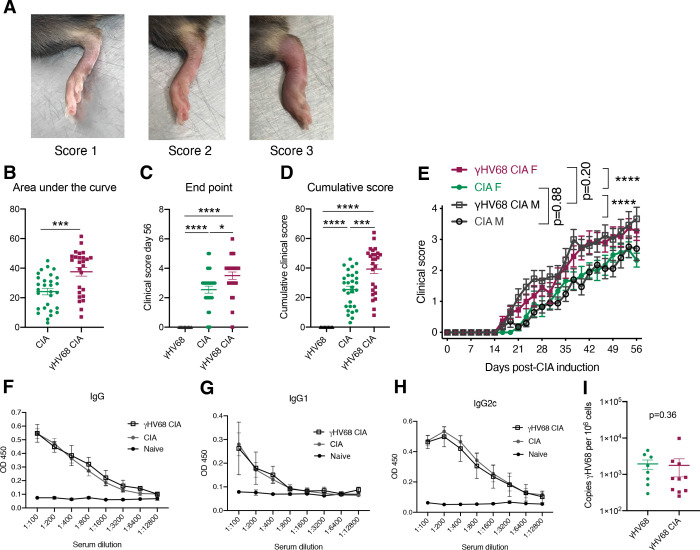
Figure 1. Progression of CIA in latent γHV68-infected and control uninfected mice.
(A) Clinical score (y-axis) of collagen-induced arthritis (CIA) measured three times weekly for 8 weeks (x-axis; days) post-CIA induction in mice without (CIA, filled circles) and with latent γHV68 infection (γHV68-CIA, open squares), and starting at day 35 post-infection in mice infected with latent γHV68 infection but not induced for CIA (γHV68, filled triangles). (B) Change (Δ, y-axis) in thickness of hind paws measured with calipers once per week and averaged for each mouse, γHV68-CIA and CIA being measured on the day of CIA induction and γHV68 at day 35 post-infection. (C) Day (y-axis) of CIA onset (considered 2 consecutive scoring days of a score of at least 1) in mice (x-axis) without (CIA) and with latent γHV68 infection (γHV68-CIA). Each data point represents an individual mouse. (A–C) Data presented as mean ± SEM. Statistical significance determined by (A, B) two-way ANOVA with multiple comparisons with F-values 329.22 (A) and 17.95 (B), (C) Mann-Whitney test. ****p<0.0001, ***p<0.001, **p<0.01, *p<0.05. (A) n = 10–29 mice per group, four experiments; (B) n = 8–20 mice per group, three experiments; (C) n = 26–29 mice per group, four experiments.


