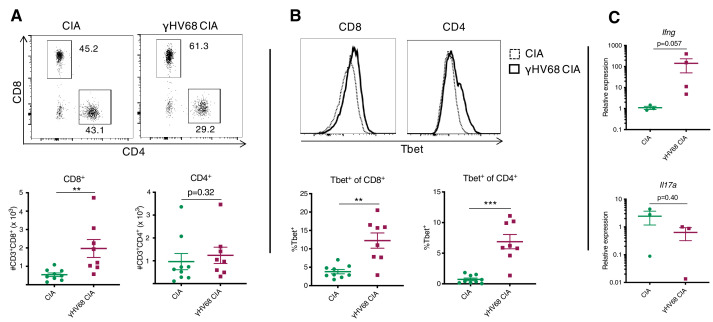
Figure 2. Analysis of immune infiltration to synovium between γHV68-CIA and control CIA mice at day 56 post-CIA induction.
(A) Representative flow cytometry plots of synovial fluid (SF) CD8+ and CD4+ T cells, previously gated on lymphocytes, singlets, live cells, and CD45+CD3+ cells. Flow cytometry plots (concatenated samples) and graphs of total numbers (y-axis) of CD45+CD3+CD8+ and CD45+CD3+CD4+ T cells in uninfected mice with collagen-induced arthritis (CIA) (filled circles) and γHV68-CIA mice (filled squares). (B) Representative flow cytometry plots of Tbet expression (x-axis) by CD8+ or CD4+ T cells in CIA mice (dotted line) and γHV68-CIA mice (solid line). Samples were previously gated on lymphocytes, singlets, live cells, and CD45+CD3+ cells. Percent of CD8+ and CD4+ T cells positive for Tbet (y-axis, gated on a full-minus-one control) in uninfected mice with CIA (filled circles) and γHV68-CIA mice (filled squares). (C) RNA extracted from synovial fluid cells, reverse transcriptase quantitative PCR (RT-qPCR) performed for Ifng and Il17a, and relative expression plotted for uninfected mice with CIA (filled circles) and γHV68-CIA mice (filled squares). (A–B) Flow plots are concatenated samples from all CIA or γHV68-CIA samples from an individual experiment, n = 8–9 mice per group; (C) n = 3–4 mice per group; (A–C) one experiment, data presented as mean ± SEM, analyzed by Mann-Whitney test; ****p<0.0001, ***p<0.001, **p<0.01, *p<0.05.

