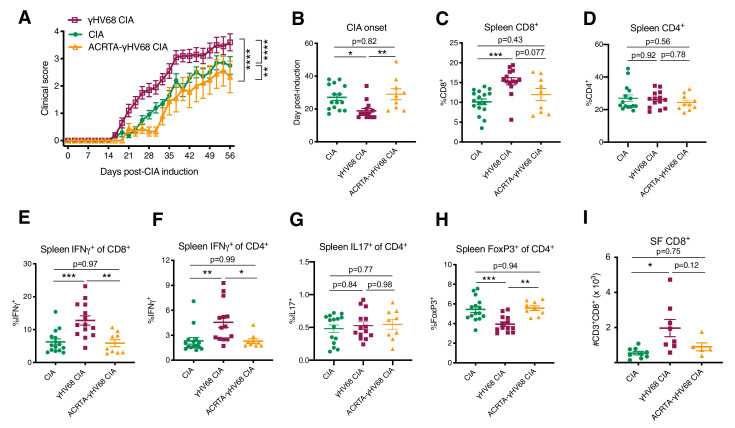
Figure 4. Disease progression and immune profile of latency-free ACRTA-γHV68 CIA mice compared to γHV68-CIA and CIA mice.
Collagen-induced arthritis (CIA) was induced in C57BL/6J mice after 5 weeks of mock, γHV68, or ACRTA-γHV68 infection, and mice scored for clinical disease until 56 days post-CIA induction. At 56 days post-CIA induction, spleens and synovial fluid were collected and processed for flow cytometry. A proportion of the CIA and γHV68-CIA data is repeated from Figure 2. (A) Clinical scores (y-axis) of uninfected mice with CIA (filled circles), γHV68-CIA mice (open squares), and ACRTA-γHV68 CIA mice (open triangles); (B–I) comparison of uninfected mice with CIA (filled circles), γHV68-CIA mice (filled squares), and ACRTA-γHV68 CIA mice (filled triangles). (B) Day (y-axis) of CIA onset, considered two consecutive scoring days of a score of at least 1, in mice (x-axis) without (CIA) and with latent γHV68 infection (γHV68-CIA) or ACRTA-γHV68 infection (ACRTA-γHV68 CIA). (C–I) Immune cell subsets determined by flow cytometry, previously gated on lymphocytes, singlets, live cells, and CD45+ cells; (C) %CD3+CD8+ of CD45+ cells in the spleen; (D) %CD3+CD4+ of CD45+ cells in the spleen; (E) %IFNγ+ of CD8+ cells in the spleen; (F) %IFNγ+ of CD4+ cells in the spleen; (G) IL17A+ of CD4+ cells in the spleen; (H) %FoxP3+ of CD4+ cells in the spleen; (I) number of CD3+CD8+ cells in synovial fluid (SF) determined by flow cytometry. (A–H) n = 9–15 mice per group, two experiments, (I) n = 5–9 mice per group, one experiment. (A–G) Each data point represents an individual mouse. Data presented as mean ± SEM, analyzed by (A) two-way ANOVA with multiple comparisons, F-value = 78.46, (B–I) one-way ANOVA with F-values 6.57 (B), 8.44 (C), 0.053 (D), 11.4 (E), 6.80 (F), 0.29 (G), 10.89 (H), and 5.64 (I); ****p<0.0001, ***p<0.001, **p<0.01, *p<0.05.

