. 2021 Jun 3;10:e67024. doi: 10.7554/eLife.67024

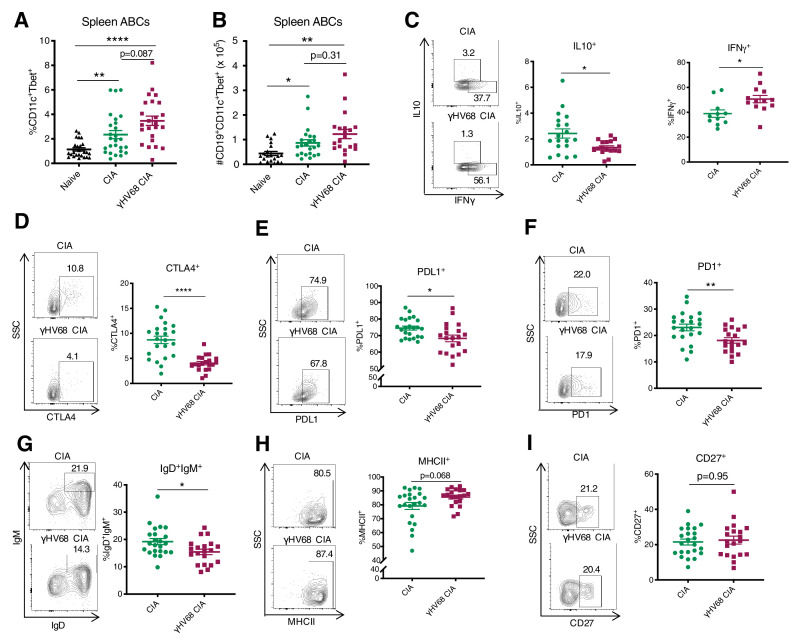
Figure 5. Analysis of ABC amount and phenotype by flow cytometry at 56 days post-CIA induction.

(A) Percentage of age-associated B cells (ABCs) (CD11c+Tbet+) of mature B cells (CD19+IgD-) in the spleen and (B) total numbers of ABCs in the spleen of naive mice (filled triangle), uninfected mice with collagen-induced arthritis (CIA) (filled circles), and γHV68-CIA mice (filled squares). (C–I) Phenotype of ABCs analyzed by flow cytometry. Samples were previously gated on splenic CD19+CD11c+Tbet+ ABCs. Flow plots are representative samples, SSC = side scatter. Proportion of ABCs positive for (C) IL10 and IFNγ, (D) CTLA4, (E) PDL1, (F) PD1, (G) IgD+IgM+, (H) MHCII, and (I) CD27. (A) n = 24–26 mice per group, three experiments, (B) n = 20–23 mice per group, three experiments, (C) n = 16–19 mice per group, two experiments, and (D–I) n = 20–23 mice per group, two experiments. (A–I) Each data point represents an individual mouse. Data presented as mean ± SEM, (A–B) analyzed by Brown-Forsythe and Welch ANOVA tests and (C–I) Mann-Whitney test; ****p<0.0001, ***p<0.001, **p<0.01, *p<0.05.

Figure 5—source data 1. Analysis of ABC amount and phenotype by flow cytometry at 56 days post-CIA induction.

Figure 5.

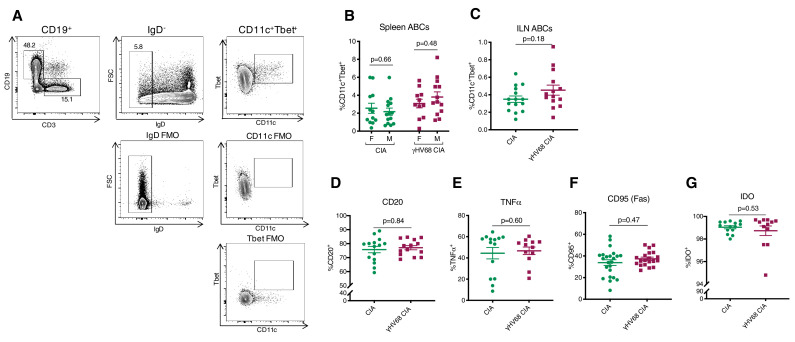
Figure 5—figure supplement 1. ABCs in the spleen analyzed by flow cytometry at 56 days post-CIA induction.

Figure 5—figure supplement 1.

(A) Representative gating strategy for age-associated B cells (ABCs) in the spleen using full-minus-one (FMO) controls. (B) Proportion of ABCs (CD11c+Tbet+) of mature B cells (CD19+IgD-) in the spleen of female (F) and male (M) mice in uninfected mice with collagen-induced arthritis (CIA) (filled circles) and γHV68-CIA mice (filled squares). Same results as in Figure 5A, separated by sex. (C) Proportion of ABCs (CD19+CD11c+) of mature B cells (CD19+IgD-) in the inguinal lymph nodes (ILNs). (D–F) Proportion of ABCs in the spleen expressing (D) CD20, (E) TNFα, (F) CD95, and (G) IDO, determined by flow cytometry. Samples were previously gated on ABCs (CD19+CD11c+Tbet+). (B) n = 11–14 mice per group, three experiments, (C) n = 14–15 mice per group, two experiments, (D) n = 14–15 mice per group, two experiments, (E, G) n = 12–14 mice per group, two experiments, (F) n = 20–23 mice per group, two experiments. (B–G) Each data point represents an individual mouse. Data presented as mean ± SEM, analyzed by Mann-Whitney test.
Figure 5—figure supplement 1—source data 1. ABCs in the spleen analyzed by flow cytometry at 56 days post-CIA induction.