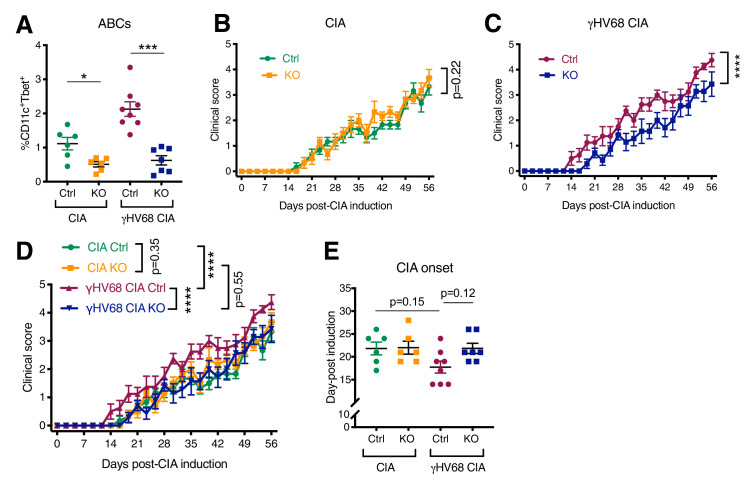
Figure 6. Disease progression and flow cytometric analysis of Tbx21fl/flCd19cre/+ (KO) and Tbx21fl/flCd19+/+ (Ctrl) mice that have been infected with γHV68 or mock-infected and induced for CIA.
(A) Proportion of age-associated B cells (ABCs) (CD11c+Tbet+) of mature B cells (CD19+IgD-) in the spleen as determined by flow cytometry of CIA flox-only control (Ctrl, green circles), CIA KO (KO, orange squares), γHV68-CIA flox-only control (Ctrl, purple circles), and γHV68-CIA KO (KO, blue squares) mice. (B) Clinical score (y-axis) of collagen-induced arthritis (CIA) measured three times weekly for 8 weeks (x-axis; days) post-CIA induction in Ctrl (green circles) and knockout (KO) (orange circles) mice that are uninfected with CIA. (C) Clinical score (y-axis) of CIA measured three times weekly for 8 weeks (x-axis; days) post-CIA induction in Ctrl (purple circles) and KO (blue circles) γHV68-infected CIA mice. (D) Clinical scores, same data as in panels (B, C). (E) Day (y-axis) of CIA onset, considered two consecutive scoring days of a score of at least 1, in Ctrl and KO CIA and γHV68-CIA mice (x-axis). (A–E) n = 6–8 mice per group, two experiments. Data presented as mean ± SEM, analyzed by (A) Mann-Whitney test, (B, C) two-way ANOVA with F-values 1.71 (B) and 62.37 (C), (D) two-way ANOVA with multiple comparisons, with an F-value of 38.14, and (E) one-way ANOVA with an F-value of 2.78; ****p<0.0001, ***p<0.001, **p<0.01, *p<0.05.


