. 2021 Jul 19;10:e66405. doi: 10.7554/eLife.66405

Figure 1. Nanopore-based assemblies are highly contiguous and complete.

(A,B) Assembly contiguity is compared to the D. melanogaster v6.22 reference genome (blue) as well as five recently published, highly contiguous Illumina assemblies (red lines, D. birchii, D. bocki, D. bunnanda, D. kanapiae, D. truncata; Bronski et al., 2020). (A) Nx curves, or the (y-axis) size of each contig when contigs are sorted in descending size order, in relation to the (x-axis) cumulative proportion of the genome assembly that is covered. (B) The distribution of contig N50, the size of the contig at which 50% of the assembly is covered. (C) Assembly completeness assessed by BUSCO v4.0.6 (Seppey et al., 2019). Note, D. equinoxialis was evaluated with BUSCO v4.1.4 due to an issue with v4.0.6. L. stackelbergi has >10% missing BUSCOs. Individual assembly summary statistics are provided in Supplementary file 2.

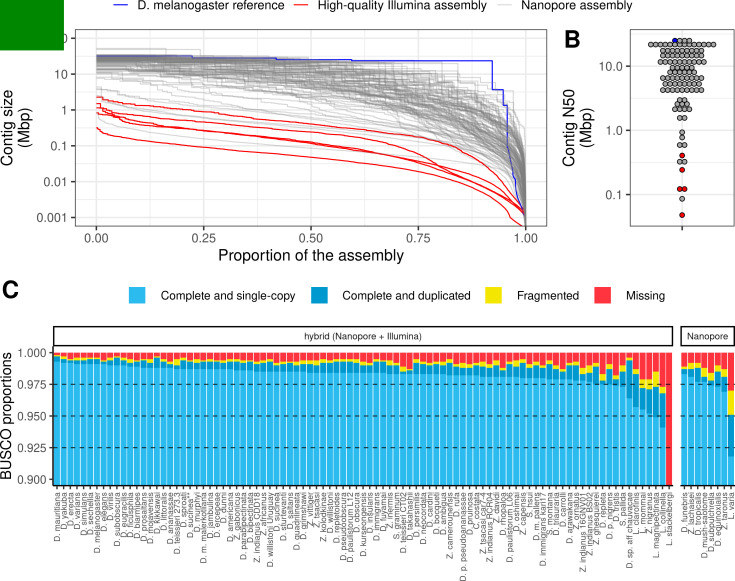
Figure 1.

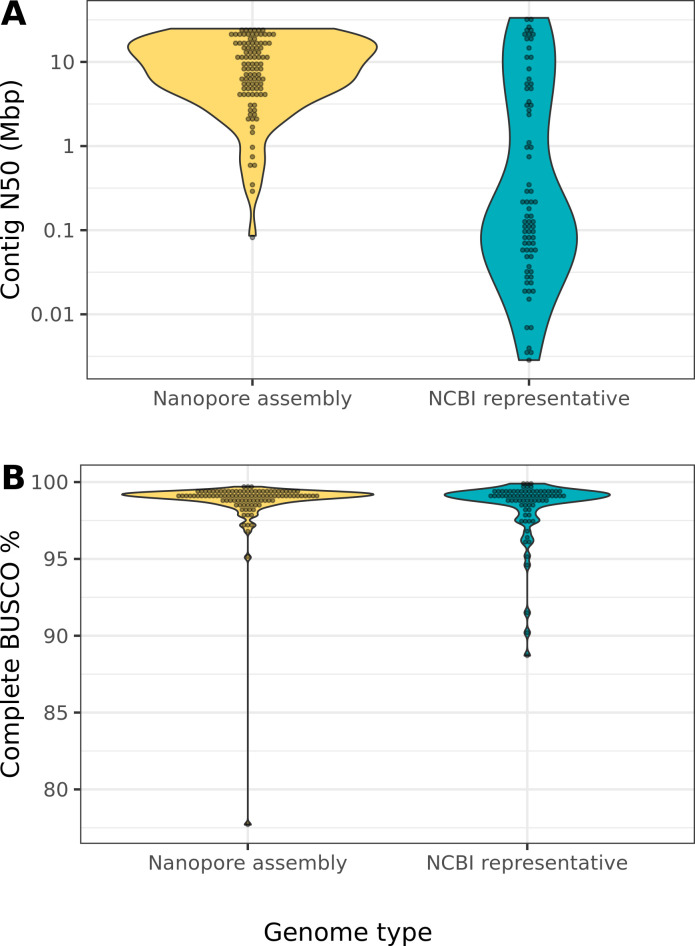
Figure 1—figure supplement 1. Nanopore-based assemblies compare favorably to representative genomes on NCBI.

Figure 1—figure supplement 1.

(A) The contig N50 of the representative genome assembly for 75 different species on NCBI (right) is compared to the contig N50s of our assemblies (left). (B) The BUSCO (Simão et al., 2015) completeness (sum of complete single-copy and complete duplicated) of the NCBI assemblies of our assemblies is compared to the BUSCO completeness of our assemblies. The list of drosophilid genomes, contig N50s, and BUSCO completeness statistics were obtained from Hotaling et al., 2021. Note, BUSCO v4 was used for both genome assessments, but the OrthoDB v10 (Kriventseva et al., 2019) Diptera gene set was used to evaluate our assemblies while the OrthoDB v10 Insecta set was used to evaluate the NCBI assemblies.
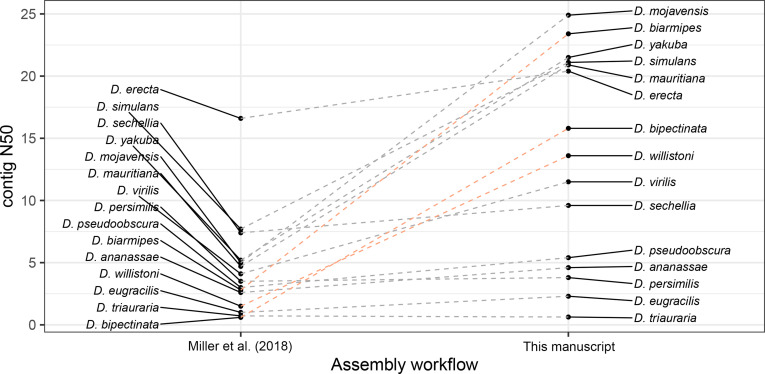
Figure 1—figure supplement 2. Large improvements in assembly contiguity from an updated assembly workflow.

Figure 1—figure supplement 2.

Points on the left depict contig N50s from Miller et al., 2018. Points on the right depict contig N50s with our updated assembly workflow. In the updated workflow, ONT raw data are basecalled with Guppy in high-accuracy mode and assembled with Flye v2.6. For D. bipectinata, D. biarmipes, and D. willistoni (depicted with the light orange lines), new ONT sequencing optimized for longer reads and of a different strain than Miller et al., 2018 was performed. For all other species, the same raw data was used for both assembly workflows.
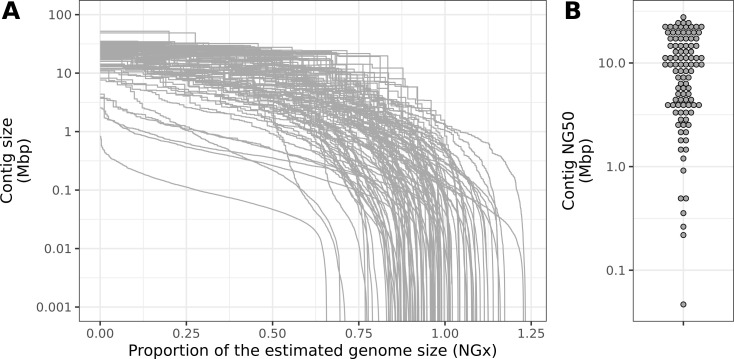
Figure 1—figure supplement 3. Contiguity metrics standardized by the estimated genome size.

Figure 1—figure supplement 3.

(A) NGx curves, or the (y-axis) size of each contig when contigs are sorted in descending size order, in relation to the (x-axis) cumulative proportion of the estimated genome size that is covered. (B) The distribution of contig NG50, the size of the contig at which 50% of the estimated genome is accounted for.
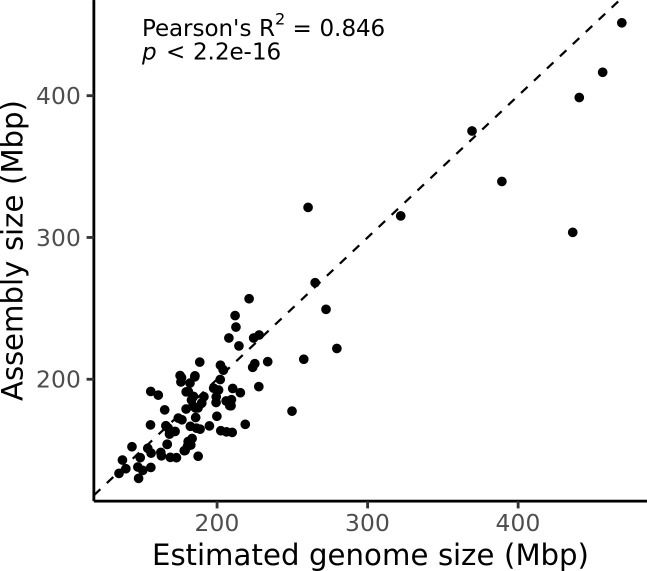
Figure 1—figure supplement 4. Estimated genome size is similar to assembly size.

Figure 1—figure supplement 4.

The genome size estimated from read coverage over known single-copy genes in each assembly (x-axis) is compared to the length of each final assembly (y-axis). The dotted line is the 1:1 line.