. 2021 Jul 6;10:e66590. doi: 10.7554/eLife.66590

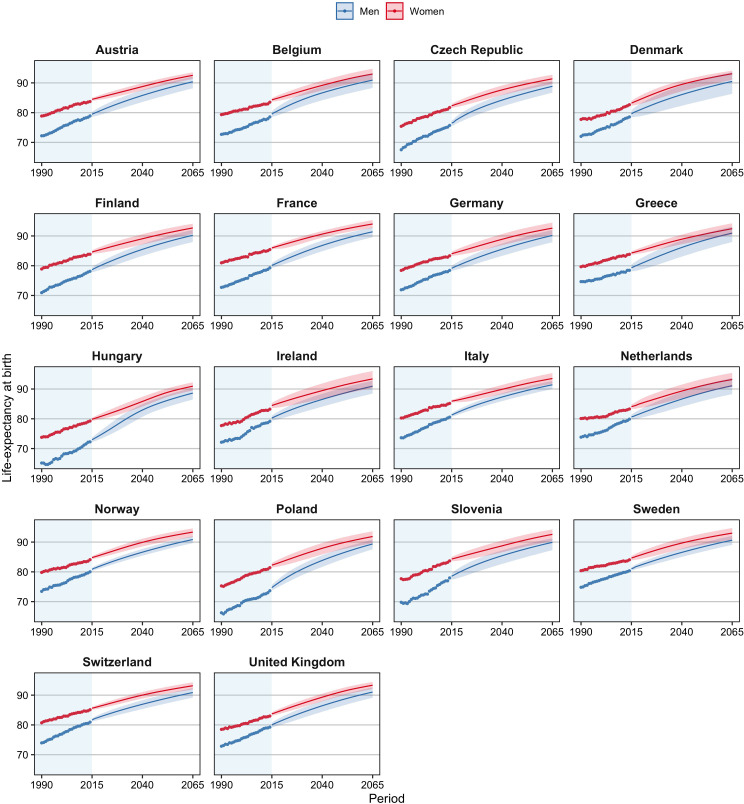
Figure 3. Observed and projected life expectancy at birth (including 95% projection intervals) using our projection approach, which takes into account the impact of smoking, obesity, and alcohol on past and future mortality trends, and the mortality experiences of forerunner countries, 18 European countries, by country and sex, 1990–2065.

Figure 3—source data 1. Data behind Figure 3.
elife-66590-fig3-data1.xlsx (198.2KB, xlsx)

Figure 3.

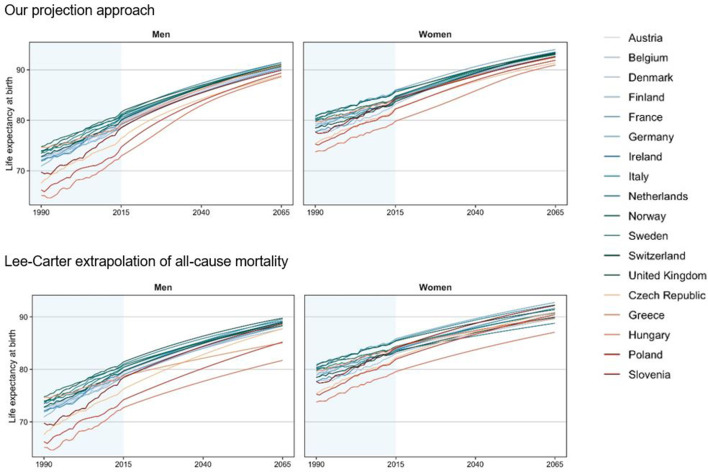
Figure 3—figure supplement 1. Comparison between countries of observed and projected life expectancy at birth, for our projection approach and the Lee–Carter extrapolation of all-cause mortality, 18 European countries, by sex, 1990–2065.

Figure 3—figure supplement 1.

Figure 3—figure supplement 1—source data 1. Data behind Figure 3—figure supplement 1.
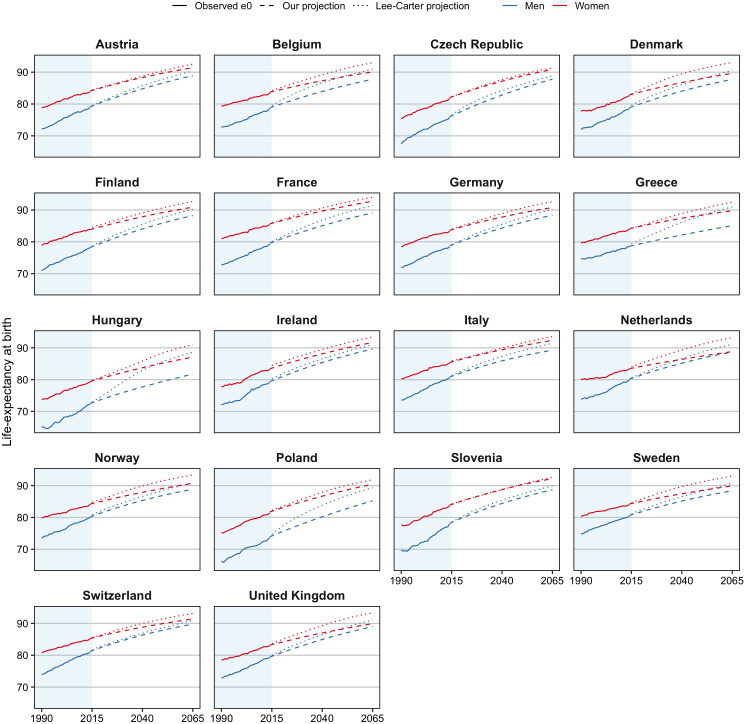
Figure 3—figure supplement 2. Observed and projected life expectancy at birth (e0), by country and sex, 1990–2065, for our projection approach, which takes into account the impact of smoking, obesity, and alcohol and the mortality experiences of forerunner countries, and for the Lee–Carter mortality projection applied to all-cause mortality.

Figure 3—figure supplement 2.

Figure 3—figure supplement 2—source data 1. Data behind Figure 3—figure supplement 2.
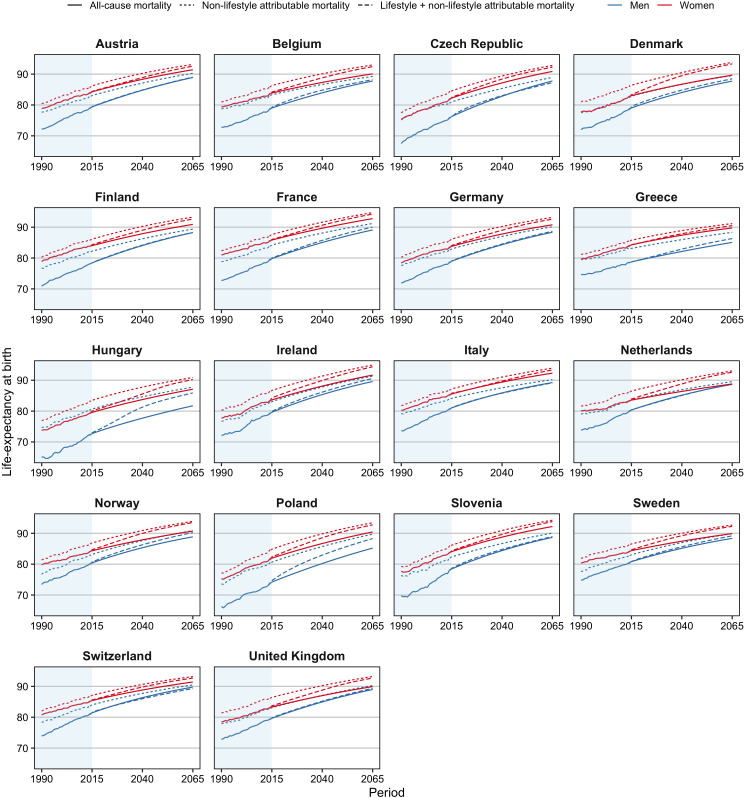
Figure 3—figure supplement 3. Observed and individually projected life expectancy at birth (e0) for all-cause mortality, non-lifestyle-attributable mortality, and the combined projection of lifestyle- and non-lifestyle-attributable mortality, 18 European countries, by sex, 1990–2065.

Figure 3—figure supplement 3.

Figure 3—figure supplement 3—source data 1. Data behind Figure 3—figure supplement 3.