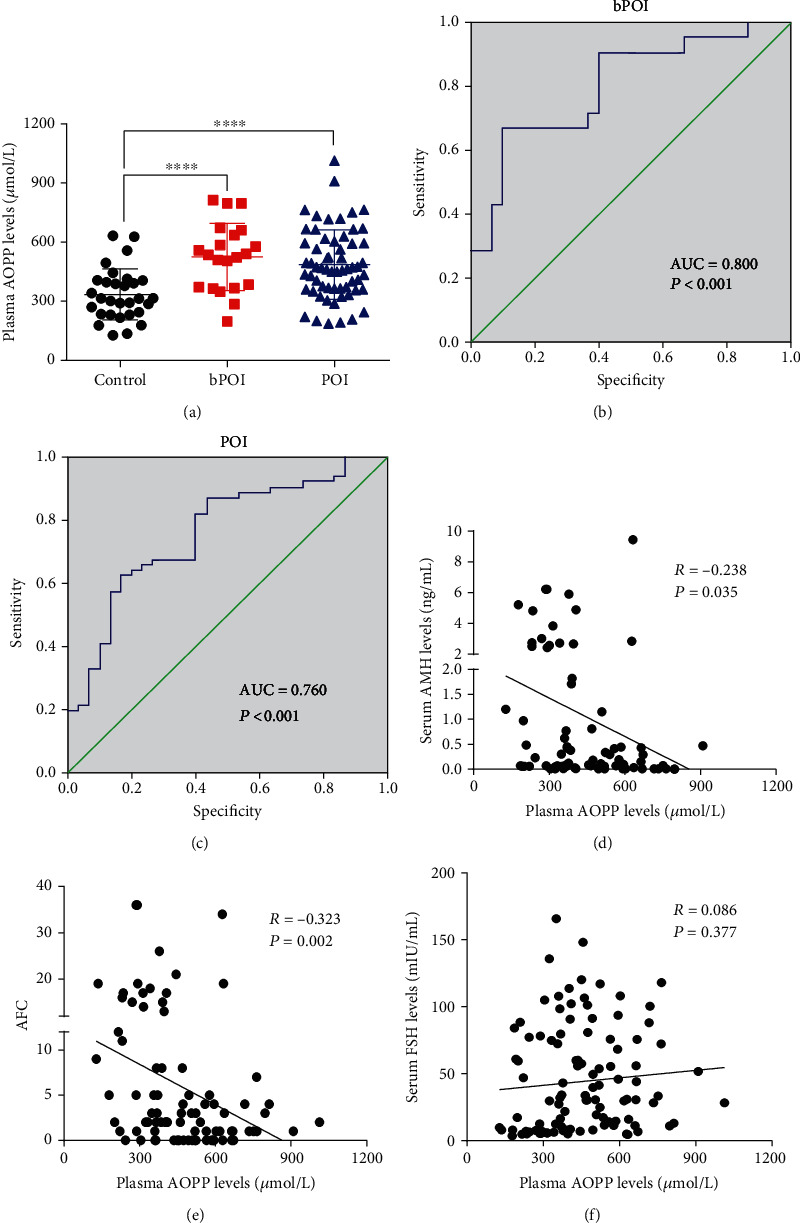
Figure 1.

AOPP accumulation in the plasma of POI and bPOI patients. (a) Plasma AOPP levels were increased in both bPOI (n = 21) and POI (n = 61) patients compared to control subjects (n = 30). (b) ROC curve analysis of plasma AOPP levels to distinguish bPOI from normal-ovarian reserve controls. (c) ROC curve analysis of plasma AOPP levels to distinguish POI from normal-ovarian reserve controls. (d) Negative correlation between AOPP levels and AMH levels. (e) Negative correlation between AOPP levels and AFC. (f) There was no correlation between plasma AOPP levels and FSH levels. ∗∗∗∗P < 0.0001 vs. the control group.
