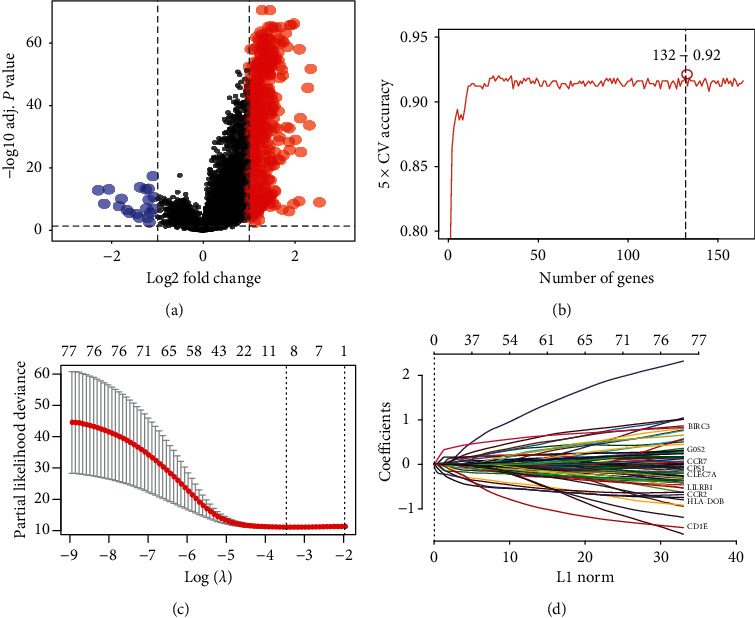
Figure 3.

Screening of immune checkpoint-related genes. (a) Differential expressed genes between the two clusters. (b) The number of genes obtained by random forest dimensionality reduction. (c) Partial likelihood deviance coefficient profiles of 77 immune checkpoint genes via 10-fold cross-validation. (d) Least absolute shrinkage and selection operator (LASSO) profiles of the selected genes.
