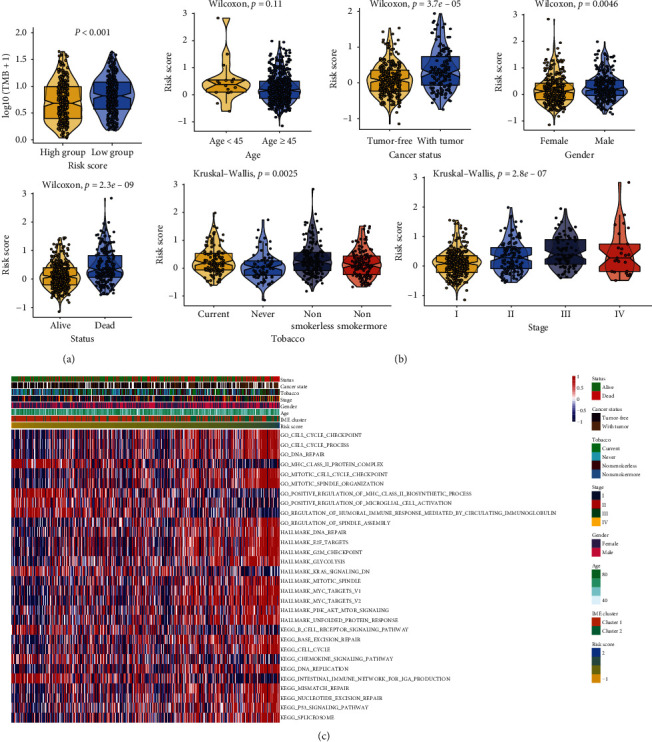
Figure 5.

Analysis of the relationship between risk score, clinical characteristics, and signaling pathways. (a) Comparison of TMB between the two risk groups. (b) The relationship between risk score model and clinical characteristics, including age, cancer status, gender, status, tobacco, and stage. (c) Function prediction of GO, Hallmark, and KEGG pathways based on risk score model.
