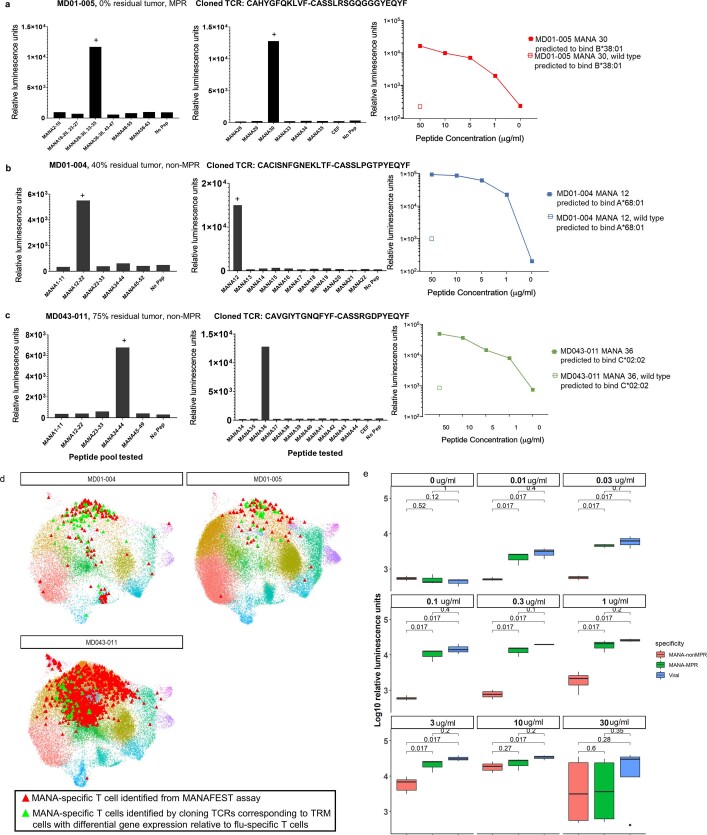
Extended Data Fig. 8. Cloning and dose response of antigen-specific T cells.
a–c, Cloning and screening of TCRs corresponding to CD8 T cells with highly differential gene expression relative to influenza-specific T cells. Seven TCRs were selected from the refined CD8 sc data based on highly differential gene expression relative to influenza-specific T cells. These TCRs were cloned into the Jurkat/NFAT luciferase reporter system and first screened against autologous LCL pre-loaded with pools of putative MANA peptides (10μg/ml) based on the respective patient’s WES and MANA predictions. Three TCRs recognized a MANA peptide pool, one each from patients MD01-005 (a), MD01-004 (b), and MD043-011 (c). The reactive MANA was then mapped from the reactive peptide pool by stimulating the TCR-transfected Jurkat cell with autologous LCL pre-loaded with 10μg/ml of each individual MANA within the reactive pool (centre). Dose–response curves were then generated for each MANA-specific TCR (right). Data are shown as relative luminescence units. A (+) sign indicates the positive response. d, Functional characterization of MANAFEST-identified and screening-identified TCRs. 2D projection of clones identified from the MANAFEST assay (red) and clones identified via cloning of TCRs corresponding to T cells with differential gene expression relative to influenza-specific T cells (green) is shown for patients MD01-004, MD01-005, and MD043-011. CD8 T cell clusters are marked with the same colour code as Fig. 2b. e, Viral-specific TCRs and MANA-specific TCRs from one patient with MPR and two patients without MPR were cloned into the Jurkat reporter system and tested against titrating concentrations of relevant peptide. The average log10 relative luminescence of viral-specific TCRs (blue, 3 clonotypes from 3 different patients), MANA-specific MPR TCRs (green, 3 clonotypes from 1 patient with MPR), and MANA-specific non-MPR TCRs (red, 7 clonotypes from 2 patients without MPR) was compared at each peptide titration. Data are shown as a Box and Whiskers plot. The middle bar shows the median, with the lower and upper hinges corresponding to the 25th and 75th percentiles, respectively (interquartile range, IQR). The upper whisker extends from the hinge to the largest value no further than 1.5 * IQR from the hinge. The lower whisker extends from the hinge to the smallest value at most 1.5 * IQR of the hinge. Comparisons of relative luminescence units for viral-specific vs MANA-specific T cell clonotypes at different titrations were performed using two-sided Wilcoxon rank sum test. ns: P > 0.05; *, 0.01 < P < 0.05.

